What Is Liquidity in Trading? A Plain Answer for When the Word Stops Making Sense
Liquidity in trading has two meanings on forums: what each one means, how to check spread and depth before you buy, and what thin markets do to stops.
Liquidity in trading is how easily you can buy or sell without moving the price against yourself. You can see it in three numbers before you trade - the bid-ask spread, the size resting at the best prices, and how much the instrument trades per day. Thin liquidity costs you on the way in, costs you again on the way out, and can fill a stop far past its price. On smart-money forums the word also means clusters of resting stop orders, which is a related but narrower idea.
Liquidity in trading is how easily you can buy or sell something without pushing the price against yourself. If you are confused about liquidity, that is usually because traders use the word for two different things: the plain market meaning (tight spreads, plenty of size at each price, steady volume) and the smart-money meaning (piles of stop orders sitting above highs and below lows). Learn the first one properly and the second one turns out to be a narrow case of it.
The plain meaning is the one that costs you money. It decides what you pay to get in, what you get when you leave, and whether your stop fills anywhere near where you put it. This page shows you how to read it in three numbers before you place a trade.
Why liquidity is so confusing: two meanings, one word
The SEC's definition is the cleanest one available. Its investor bulletin on after-hours trading says "liquidity refers to the existence of buyers and sellers who are willing to trade with incoming orders and the degree of price competition among buyers and sellers." Read that twice. Liquidity is the people already waiting with orders, and how hard they compete to be first in line. When there are many of them and they quote prices a penny apart, your order slides in and barely moves anything. When there are few of them, your order becomes the event.
Then you open a YouTube video on smart money concepts and hear that price "goes to grab liquidity" above an old high. In that language, liquidity means the stop-loss orders and breakout buy orders resting just past an obvious level. When those stops trigger they turn into market orders, and a large trader who wants to sell can sell into that sudden burst of buying. We covered how traders try to use that idea in the liquidity trading strategy guide, including what the backtests found.
The two meanings connect. Both describe orders waiting to be filled. The SEC version asks how many orders sit near the current price right now, ready to take the other side of yours. The smart-money version points at one specific pocket of orders at a known level. If you only learn one, learn the first, because it applies to every trade you place, including the ones that have nothing to do with sweeps.
What liquidity in trading actually measures
No single number captures liquidity, but three numbers get you most of the way, and you can see all three on a normal quote screen.
The bid-ask spread is the gap between the highest price a buyer is offering and the lowest price a seller will accept. A stock quoted 49.99 bid and 50.00 ask has a one-cent spread. A stock quoted 3.95 bid and 4.05 ask has a ten-cent spread on a much smaller price, which is 2.5 percent of the stock. Spread is the toll you pay to trade right now instead of waiting.
Depth is how much size sits at and near those best prices. A one-cent spread with 100 shares on the ask is a thin market wearing a good-looking quote. A one-cent spread with 40,000 shares stacked across the next few cents is a deep one. Depth answers the question the spread cannot: what happens when your order is bigger than the first price level?

Volume is how much trades over a session. It matters because it tells you how quickly the order book refills after someone takes the size out of it. A stock that trades millions of shares a day will usually have new bids and offers back within moments of a large order. A stock that trades 40,000 shares a day can leave a hole in the book for minutes. That refill speed is sometimes called resiliency, and it is the part of liquidity you only notice when it is missing.
Each of the three can mislead on its own. Volume can be high on one news spike and thin the rest of the week. A tight spread can sit on top of almost no depth. Depth shown on the screen can be pulled the instant price moves toward it. You check all three because each covers what the others hide.
What thin liquidity does to your order
Here is the mechanism in one worked example. The numbers are illustrative, chosen to make the arithmetic easy to follow, but the shape is exactly what a thin order book does.
Say a small-cap stock shows a bid of 9.98 and an ask of 10.02. Behind the ask, sellers are resting like this: 100 shares at 10.02, 200 at 10.04, 300 at 10.07 and 400 at 10.12. You send a market order to buy 1,000 shares.
Your order takes the 100 at 10.02, then the 200 at 10.04, then the 300 at 10.07, then the 400 at 10.12. That is called walking the book. Your total cost is 10,079 dollars, an average of about 10.079 per share. The screen said 10.02. You paid almost six cents more per share than the quote you saw, and you also just lifted the ask to 10.12, so the next buyer sees a higher price and your own position is marked against a bid that has not moved.
Bar chart of the average fill price for a market buy order in an illustrative thin order book with a 10.02 best ask: 100 shares fill at 10.020, 300 shares average 10.033, 600 shares average 10.052, and 1,000 shares average 10.079.
Six cents sounds small until you put it next to your stop. If your plan was to risk 25 cents a share on this trade, walking the book used up almost a quarter of that risk before price moved at all. On a liquid large-cap with thousands of shares at every penny, the same 1,000-share order would most likely fill at the quoted ask, or within a cent of it.
A limit order fixes the price and gives up the certainty of a fill. If you had placed a limit buy at 10.04, you would have received the first 300 shares and nothing above that price. Whether that is better depends on whether you need the full position. In a thin stock it usually is better, because a partial fill at your price beats a full fill at a price that wrecks the trade's risk-reward.
The spread is a cost you pay twice
Traders new to liquidity tend to think of the spread as a one-time entry fee. You pay it twice: once when you buy at the ask, and again when you sell at the bid. Mark a new position to the bid and you are down the full spread the second you are filled.
Compare two positions of roughly 10,000 dollars each.
- Stock A trades at 50.00 with a one-cent spread. You buy 200 shares at 50.00. Marked to the 49.99 bid, you are down 2 dollars, or 0.02 percent.
- Stock B trades at 4.00 with a ten-cent spread (3.95 bid, 4.05 ask). You buy 2,500 shares at 4.05. Marked to the 3.95 bid, you are down 250 dollars, or 2.5 percent, before the stock has done anything.
To break even on Stock B, the bid has to rise ten cents just to reach your entry price. A trader who scalps for 10 or 15 cents a move cannot make money in Stock B, because the spread eats the whole target. That is why the cost math matters so much for short holding periods, which we worked through in detail in the scalp trading guide. For a swing trader aiming for two dollars, a ten-cent spread is a nuisance. For a scalper it decides whether the strategy exists.
The spread also widens and narrows through the day, so the number you see at noon may not be the number you pay at the open. Check it at the moment you plan to trade.
Liquidity in crypto: the same coin, different venues
Crypto makes the venue problem obvious, because the same token trades on dozens of exchanges with separate order books. Order-book data published by Lyra Terminal, updated October 29, 2026, shows Ethereum on Binance with about 7.8 million dollars of resting orders within 2 percent of the mid price and a median spread under 0.1 basis points. Lyra's figures put total Ethereum depth within 2 percent at 65 million dollars or more across the 18 exchanges it samples.
A smaller token tells a different story. On the same tracker's KAIA page, Binance shows about 29,900 dollars within 2 percent of the mid, and a median spread of 27.1 basis points. That is roughly 260 times less depth than Ethereum on the same exchange. Across the venues Lyra lists, the KAIA spread ranges from 8.8 basis points on OKX to 99 on HashKey Global, and two venues showed no resting depth within 2 percent at all.
Bar chart of median bid-ask spreads in basis points from Lyra Terminal data updated October 29, 2026: Ethereum on Binance under 0.1, then KAIA on OKX 8.8, Gate 10.7, Bitget 15.5, KuCoin 17, Binance 27.1, MEXC 28.9, LBank 38.1, Bitfinex 41.4, WhiteBIT 72.2, BingX 76.6 and HashKey Global 99.
The practical point: a chart can look identical on two exchanges while the cost of trading it differs by a factor of ten. Before you trade a small token, check the order book on the venue you actually use. A clean breakout on the chart means little if a 2,000-dollar market order moves the price a full percent.
Stops in thin markets
This is where liquidity stops being an abstract cost and turns into a risk. A standard stop order is a market order waiting for a trigger. FINRA's guide to stop orders in volatile markets puts it directly: "A stop order becomes a market order once the stop price is reached," and "the price you receive upon execution, though, could be markedly different than your stop price."
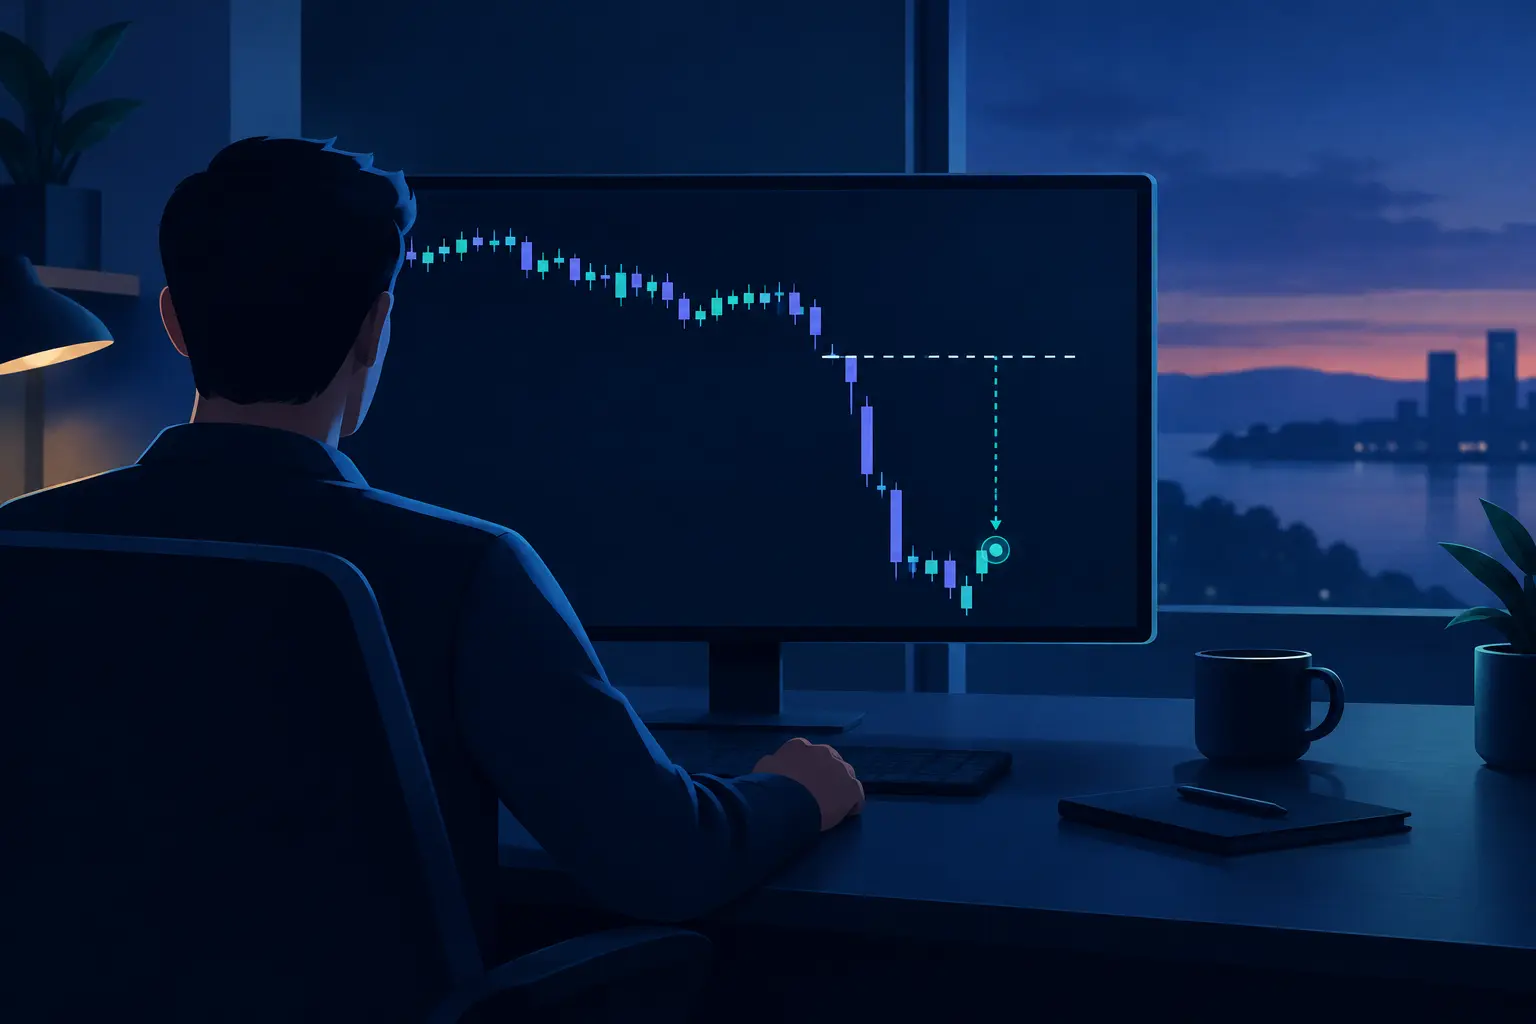
In a liquid stock, "markedly different" usually means a few cents. In a thin one it can mean a lot. Take the Stock B position from above: 2,500 shares bought at 4.05 with a stop at 3.80, so a planned risk of 25 cents a share, or 625 dollars. Bad news comes out after the close, and the stock opens at 3.40. Your stop triggers at the open and fills somewhere around 3.40, or lower if the bids are thin. The loss is at least 65 cents a share, 1,625 dollars, more than two and a half times what you planned.
A stop-limit order caps the fill price, but it trades one risk for another. FINRA notes that a stop-limit order fills only "if your brokerage firm can obtain the specified limit price or better," and that "there's no guarantee that your order will be executed." With a stop-limit at 3.75 in the gap example, nothing fills at the open. You are still holding the stock at 3.40, and it can keep falling. Neither order type removes gap risk. The tool that actually reduces it is position size: in a thin stock, size the position so that a stop filled well past its level still fits inside what you can afford to lose. Where to put the stop in the first place is its own skill, covered in where to place a stop loss.
FINRA also warns about the reverse case: a fast drop can trigger your stop, and "the stock might later rebound and resume trading at its prior price level." Thin books make those short spikes more likely, because it takes less selling to knock out the bids for a moment.
Liquidity changes by the hour
Liquidity is not a fixed property of a stock. It moves through the day and drops away at specific times.
Outside regular hours it falls sharply. The same SEC bulletin warns that in after-hours trading "there generally is less trading interest and less price competition for most stocks," that "the reduced level of trading interest in after-hours trading generally results in wider spreads between the bid and ask prices for a stock or no quotes at all," and that "many brokerage firms currently accept only limit orders in order to protect investors from unexpectedly bad prices." If a stock you trade comfortably at 11 a.m. looks strange at 7:30 a.m., that is why.

Inside the session, the first minutes after the open usually bring the heaviest volume and also the widest spreads, as overnight orders get matched and market makers work out where the price should be. Midday tends to be quieter, with thinner books on smaller names. The close brings volume back. Scheduled news, such as an earnings release or a rate decision, can pull resting orders right before the number comes out, so the book is thinnest exactly when price is about to move fastest.
For forex and crypto, the session matters too. A currency pair trades around the clock, but depth is lower when the major financial centers are closed, and weekend gaps can open far from Friday's close. Holidays thin out every market at once.
The habit to build: look at the spread and the depth at the time you plan to trade. How the instrument usually behaves at noon tells you little about 7 a.m. or the minute before a news release.
Options liquidity: the spread is a bigger share of the price
Options make every liquidity problem bigger, because the contract prices are small and the spreads are not. An option quoted 1.00 bid and 1.20 ask has a 20-cent spread. Each contract covers 100 shares, so buying at the ask and marking to the bid puts you down 20 dollars per contract on a 120-dollar position. That is about 17 percent of what you paid, gone at the moment of the fill.
Compare that with the same stock's shares, which might trade with a one-cent spread. The options on a stock can be far less liquid than the stock itself, especially at strikes far from the current price and in expirations months away. Open interest (the number of contracts currently held) and daily volume on that specific strike tell you whether there is a real market or just a market maker quoting wide.
Practical rules that hold up: work a limit order near the middle of the spread and give it time rather than hitting the ask; prefer strikes and expirations where the spread is a small fraction of the option price; and plan your exit before you enter, because the bid may be even further away on the day you want out. If you are screening for which underlyings have liquid options, the stock screener for options trading guide shows which filters to set.
How to read liquidity on the chart itself
You do not need a Level 2 screen to spot a thin market. The chart shows it if you know where to look, and these signs sit alongside the normal price action you already read.
Gaps between candles inside the session. On a liquid stock, one five-minute candle usually opens near where the previous one closed. When candles keep opening a few cents away from the prior close, the book is thin enough that each trade jumps price.
Long wicks on low volume. A long wick on heavy volume shows real buying or selling at that level. A long wick on a tiny volume bar often means one order went through an empty book and nobody was there to meet it. Do not read it as support or resistance in the same way.
Flat stretches and single-print bars. Candles that are just a dash (open, high, low and close at one price), or minutes with no candle at all, mean nobody traded. Any level you draw on that stretch reflects a handful of trades.
Volume bars that disappear midday. If the volume histogram collapses after the first hour, the stock may be tradeable at the open and thin by lunch. Your stop has to work at lunch too.
Volume and turnover are also why a scanner should filter liquidity before anything else. The day trading scanner setup guide starts with average volume and price filters for exactly this reason: a perfect pattern in an untradeable stock is not a setup.
What to check before your next trade
If you are confused about liquidity right now, this is the short version to run before the next order.
- Read the spread as a percent of price. Divide the spread by the ask. One cent on a 50-dollar stock is 0.02 percent. Ten cents on a 4-dollar stock is 2.5 percent. Compare that number with the profit you are aiming for.
- Compare your size with the size at the best price. If your order is bigger than what sits at the ask, you will walk the book. Either cut the size, split the order, or use a limit.
- Check average volume and today's volume. A stock trading far below its usual volume today will behave like a thinner stock than its average suggests.
- Check the clock. Pre-market, after-hours, the minutes around scheduled news and holidays all thin out the book.
- Plan the exit in the same terms. Ask what the bid will look like when you want to sell, including the day the news is bad.
- Size for the gap. In a thin market, assume the stop can fill well past its price and size the position so that the worse fill is still survivable.
None of these checks guarantee a good fill. They make a bad one less of a surprise.
Where an app honestly helps (and where it does not)
Quant AI reads a chart screenshot and marks the trend, key levels and the setup it sees. That helps with half the job: knowing where the levels are, so you can place entries and stops at prices that make sense. It also gives you a second read on a chart before you commit, or a post-mortem on a trade where the fill surprised you.
It does not see the order book. A screenshot shows candles and volume bars, so the app cannot tell you the live spread, how much size sits at the ask, or whether the bids will hold at the open. You still check those on your broker's quote screen before you trade. It also cannot prevent slippage or a gap, and it does not make any trade safer to size up. Liquidity is a check you run yourself, every time.
How to keep liquidity from surprising you again
- Add a minimum average volume and a minimum price to every scanner or watchlist you build.
- Write the spread, as a percent of price, in your trade plan next to the target and the stop.
- Default to limit orders in anything with a spread wider than a few cents.
- Treat after-hours and pre-market quotes as a different, thinner market.
- Size positions in thin names for the fill you could get on a gap, not the stop price you typed.
- Review your fills each week: compare the price you expected with the price you got. If the gap is consistently large on certain names, stop trading them.
Frequently asked questions
What is liquidity in trading, in one sentence?
It is how easily you can buy or sell an instrument without moving its price, which shows up as a tight bid-ask spread, real size at the best prices, and steady volume through the session.
What is buy-side liquidity?
In smart money language, buy-side liquidity is the cluster of buy orders resting above a recent high: short sellers' stop-losses and breakout traders' buy stops. Sell-side liquidity is the matching cluster below a low. It is a narrower use of the word than the market definition, and the liquidity trading strategy guide covers how traders try to trade it.
Is liquidity the same as volume?
No. Volume is how much traded; liquidity is how much you could trade right now without moving price. High volume usually comes with good liquidity, but a stock can print big volume on one news spike and still have a thin book an hour later.
Is high liquidity always better?
For getting in and out at fair prices, yes. The tradeoff is that the most liquid instruments are also the most heavily traded by professionals, so a high-liquidity market is cheap to trade but not easy to beat. Lower liquidity can bring bigger moves, along with wider spreads and worse fills on the way out.
The order book shows far more bids than asks. Does that mean price will go up?
Not necessarily. A trader on r/technicalanalysis described Micron showing an imbalance of "roughly 96 bid vs 4 ask," then added, "The actual best bid is only 2 lots. Two. Meanwhile the ask side has 55 sitting at the offer." An imbalance figure can hide where the size actually sits, and displayed orders can be cancelled before price reaches them. Treat imbalance as one input, never as a prediction.
What makes a stock liquid?
Many shares outstanding and available to trade, many participants, steady interest through the day, and market makers competing to quote it. Large-cap stocks and the major index ETFs sit at the liquid end. Small caps, recent listings with a small free float, and anything that trades a few thousand shares a day sit at the thin end.
Why did my stop fill so far below my stop price?
Because a stop becomes a market order when it triggers, and a market order takes whatever bids are there. If price gapped past your stop, or the bids were thin, the next available price was lower. A stop-limit avoids the bad fill but may not fill at all.
Can I trade low-liquidity stocks safely?
You can trade them more carefully, which is not the same as safely. Use limit orders, trade smaller, avoid holding through news, and size every position so a gap past your stop is still a loss you can absorb. Trading involves risk of loss in any market, and thin markets add the risk of not being able to get out at a reasonable price.