Free Technical Analysis Software With Buy Sell Signals: What the Arrows Are Worth (2026)
TradingView, thinkorswim, MetaTrader 5 and NinjaTrader compared on the buy sell signals they print for free, why many arrows repaint, and how to test one.
Four platforms give you free technical analysis software with buy sell signals worth testing. TradingView has the largest library of community signal scripts and a strategy tester on the free plan. Thinkorswim turns any study into a strategy and lists every hypothetical trade it would have taken. MetaTrader 5 is free, ships with built-in indicators, and runs Expert Advisors; its copy-trading Signals service is the part you pay for. NinjaTrader is free to chart and simulate futures strategies. All four will draw arrows on a chart for $0. None of them can tell you whether an arrow is worth following, and that is the real question.
A buy sell signal is a rule that somebody wrote down and the software plots as an arrow. The rule might be "close crosses above the 20-day average" or a dozen conditions stacked together, but it is still a rule, and it carries the same weaknesses as any other rule: it fits some markets and fails in others, it can be tuned until the past looks perfect, and some scripts quietly redraw old arrows after the fact. This comparison covers what each free platform gives you, the repainting problem that makes so many signal scripts look better on old charts than they trade, and a worked test you can run on any signal before money goes near it.
Quick comparison
| Software | What signals it gives free | How you test them | The catch |
|---|---|---|---|
| TradingView (Basic) | Built-in strategies plus thousands of community scripts that print buy and sell arrows | Strategy Tester with a trade list and metrics | 2 indicators per chart on Basic; commission and slippage are 0 unless you set them |
| thinkorswim | Built-in strategies, plus any study turned into a strategy with thinkScript's AddOrder | Strategy Report listing each suggested trade and its P/L | Signals are hypothetical and cannot send real orders; needs a Schwab account |
| MetaTrader 5 | Built-in indicators, custom indicators and Expert Advisors that can trade automatically | Strategy Tester on your broker's history | The Signals service copies other traders' accounts on a paid subscription |
| NinjaTrader | Free charting and strategies for futures | Simulation and strategy analysis | Built around its own futures brokerage; live trading costs money |
What a buy sell signal actually is
Every buy sell signal indicator belongs to one of a few families, even when the marketing hides it. Crossovers fire when one line passes another: price over a moving average, a fast average over a slow one, MACD over its signal line. Threshold signals fire when an oscillator reaches a level, such as RSI below 30 for a buy. Breakout signals fire when price closes beyond a support or resistance level. Most "all in one" scripts combine two or three of these, then add a filter so they fire less often.
Two scripts from TradingView's public library this autumn show the range. "Breakout & Retest Buy Sell Signals with TP & SL" by LunqFX prints an arrow when price breaks a support or resistance level and the retest holds, and it draws a stop, three take-profit targets, and a lot size for your account. "Market Axiom" by AxiomTradeSystems describes three strategy engines (momentum, trend following and mean reversion) and says it picks the best one for each ticker. The first is a breakout rule with risk levels attached. The second is a rule that chooses among rules, which makes it harder to audit: you cannot tell from the chart which engine fired or why.
That difference matters more than the platform. A signal you can read in one sentence is a signal you can test, size, and reject. A signal built from a dozen hidden conditions can only be trusted or distrusted, and trust is a poor basis for sizing a position. When you shop for free signals, the first filter is whether the rule is published. On TradingView, open-source scripts show their Pine code; on thinkorswim, every built-in strategy can be opened in the thinkScript editor; on MetaTrader 5, indicators and Expert Advisors come either with source (.mq5) or compiled only (.ex5). A compiled-only file means taking the author's word for what it does.
The second filter is what the signal claims to tell you. An arrow is an entry. It says nothing about where the trade is wrong, how much of your account to risk, or when to take profit, unless the script also draws those. The LunqFX script is popular partly because it draws all three. A bare arrow leaves you to supply the stop yourself, and where you place a stop loss decides more of the outcome than the entry does.
TradingView: best free source of signal scripts
TradingView's free Basic plan is where most people find buy sell signals, because the community library is huge and searchable. Type "buy sell" into the indicator search and you get pages of scripts, most of them free and many open-source. The built-in strategies (moving average cross, MACD, RSI, Bollinger Bands and others) are a cleaner place to start, because their logic is short and documented.
The limits are the plan's, and they bite quickly for signal hunters. TradingView's pricing page lists the Basic plan at 1 chart per tab, 2 indicators per chart, 3 active price alerts, and 5,000 historical bars. Essential, at a listed €12.95 a month billed annually when we checked, raises that to 5 indicators per chart, 20 price alerts, 100 technical alerts, and 10,000 bars. Two indicators is enough for one signal script plus one filter. It is not enough to stack a signal, a trend filter, and a volume check on the same chart, which is how many people use these scripts. The 5,000-bar cap also limits testing: on a 5-minute chart that is about three months of regular US sessions (78 bars a day), so any intraday signal tested on Basic is tested on one market regime.
The strategy tester is the reason TradingView earns its place here. A script declared as a strategy (as opposed to a plain indicator) produces a trade list, an equity curve and metrics. Read the defaults before you read the results. The Pine Script strategies documentation says that "if not specified, the strategy applies no commission to filled orders," and the slippage default "is 0." It also notes that the broker emulator fills orders "using only the available chart data by default" and that when price gaps past an order level, the fill comes at the opening price of the next bar. A free strategy tested with zero costs on 5,000 bars describes a market nobody trades in. Set commission and slippage in the strategy's Properties tab before you look at a single number.
Most signal scripts are indicators, not strategies, and an indicator has no tester at all. You can still test one by hand with Bar Replay, which our free backtesting app comparison covers in detail, but it is slower, and you have to log every trade yourself.
thinkorswim: best free signals you can audit trade by trade
Thinkorswim treats signals as a separate object. Studies calculate a value for each bar; strategies add simulated buy and sell orders on top. The thinkScript tutorial puts it plainly: the AddOrder function "will turn any technical indicator into trading strategy," and its example adds a buy signal every time the close crosses above its 20-period simple moving average and a sell when it crosses back below. Right-click any arrow, choose Show Report, and you get a table of every suggested trade with its price, time, trade P/L and cumulative P/L.
That report is the most useful free signal audit in this group, because it lists trades rather than summarising them. You can scroll to the worst losing streak and look at the chart around it. You can see whether the profit came from three outlier trades or forty ordinary ones.
The tutorial is also honest about the limit: "all the signals you get are hypothetical, i.e., you cannot send real orders using strategies," as the thinkScript strategy chapter states. Thinkorswim strategies are a research tool, and any trade from one goes through your own order ticket. The Learning Center pages also carry Schwab's disclaimer that past performance is no guarantee of future results and that it does not recommend technical analysis as a sole means of investment research. The platform is free with a Schwab account.
MetaTrader 5: free indicators, paid copied signals
MetaTrader 5 is free to download, and most forex and CFD brokers hand it out. It ships with built-in indicators, and the MQL5 marketplace and code base hold thousands of custom indicators that draw buy and sell arrows. It is also the only platform here where a signal can trade on its own: an Expert Advisor is a program that places orders when its conditions are met. MT5's Strategy Tester runs Expert Advisors on your broker's history.
The word "Signals" in MT5 means something else. The MetaTrader 5 Signals service copies another trader's trades into your account automatically. Providers set a fixed subscription price, and the page shows each provider's growth, equity and balance graphs, full trade history, and a risk assessment. MetaQuotes states that it "is a software development company and does not provide investment or brokerage services." So the software is free, but a copied signal is a paid subscription to a stranger's account, and the published track record is the provider's past, on the provider's broker, at the provider's size.
If you use MT5 for signals, stay with indicators and Expert Advisors whose source you can read, test them in the Strategy Tester with your broker's real spread, and treat the copy service the way you would treat any paid tip line.
NinjaTrader: free futures charting with strategy signals
NinjaTrader is free to chart and to run in simulation, and its strategy tools let you build signals from its indicators and test them on futures data. It suits a futures trader who wants signals on ES, NQ or CL charts and a simulator in the same window. The trade-off is that the platform is built around NinjaTrader's own brokerage, and live trading and some data feeds cost money. For a broader look at the free futures simulators, see our futures paper trading platform comparison.
Repainting: why the arrows look perfect on old charts
Open a signal script on a year of history and the arrows often look uncanny: buys at the exact lows, sells at the exact highs. Most of the time the reason is repainting. TradingView's Pine Script documentation defines it as "script behavior causing historical vs realtime calculations or plots to behave differently." The arrow you see on last March was not necessarily on the chart last March.
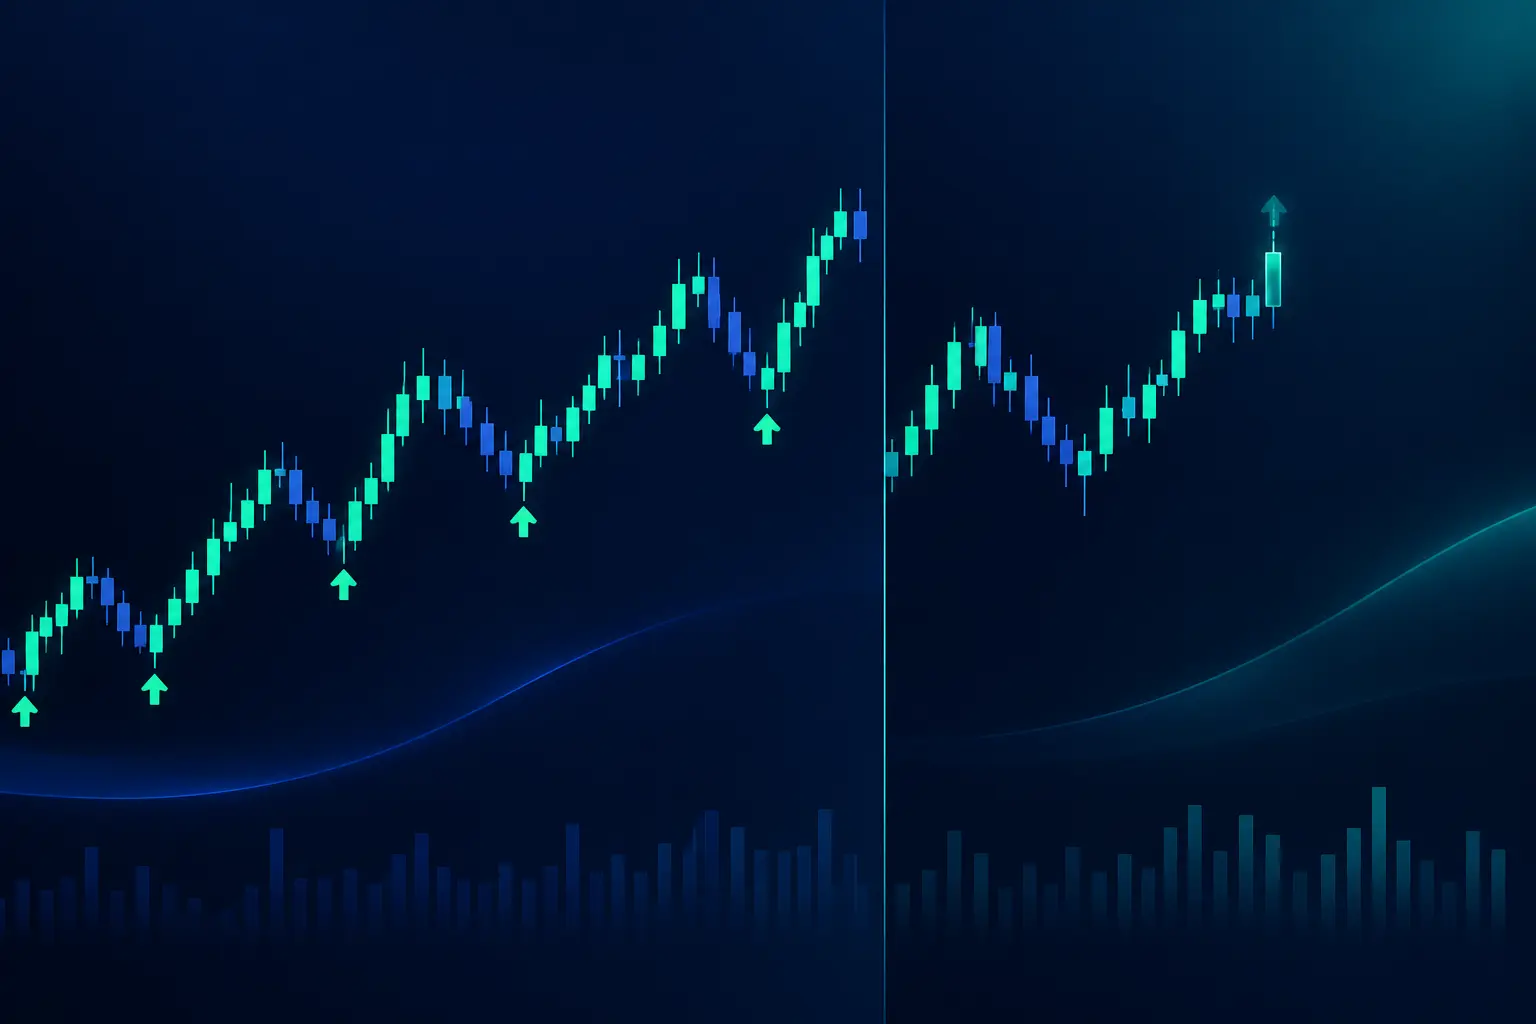
The repainting page sorts the causes by how much harm they do, and three matter most for signal hunters.
Signals on the unfinished bar. On a live bar the high, low and close keep changing until the bar closes. A script that checks its condition on every tick can print an arrow at 2:10 p.m. and erase it by 2:15 when price moves back. On history, only the arrows that survived the close remain, so the backtest shows the winners and hides the flickers. The documentation's fix is to add barstate.isconfirmed to the condition, which makes the signal wait for the bar to close and behave the same on history and live. The cost is a later signal, which the page sums up as "You can't have your cake and eat it too."
Plotting into the past. Pivot and swing scripts often need several bars to the right before they can confirm a low. Say a script needs 5 bars to confirm a pivot on a daily chart. Price makes a low at $48.20 on a Monday. The script cannot know it was a pivot until the following Monday, when price might be at $51. It then draws the buy arrow back on the $48.20 bar. On history it looks like a buy at the low. Live, the earliest you could have acted on it was $51, a week later. (These prices are an illustration of the mechanism, not a measured trade.) The documentation lists plotting in the past as "potentially misleading" and suggests making it an opt-in input.
Future data leaking into history. Scripts that pull a higher timeframe with request.security() and lookahead turned on, without offsetting the value by one bar, "will return data from the future on historical bars, which is dangerously misleading," per the same page. A daily signal on an hourly chart can then know the day's close at 10 a.m. TradingView says publications that use lookahead to produce misleading results get moderated, but that covers published scripts; a private script someone sends you has had no such check.
The page's advice is to stop asking whether a script repaints and ask specific questions: do its alerts wait for the bar to close, does it plot values into the past, and does its request.security() call leak future data. You can answer the first two without reading code: watch the script live for a week, screenshot each arrow when it appears, and compare the screenshots with the chart a week later. Any arrow that moved or vanished tells you how the history was drawn.
A worked example: testing a 20-SMA crossover on a free plan
Here is the full test on the simplest signal there is, the one thinkorswim uses in its own tutorial: buy when the daily close crosses above the 20-period simple moving average, sell when it crosses below. The numbers below are illustrative, chosen to show how each step changes the result; run the same steps on your own chart to get real ones.
- Confirm the rule waits for the close. The built-in crossover strategies on TradingView and thinkorswim evaluate at the bar close on history. If you code your own in Pine, add
barstate.isconfirmedto the entry condition. - Run it at the platform defaults. Say the strategy tester reports 48 round-trip trades over two years on 100 shares of a $50 stock, with a net profit of $1,150. That is the number most signal screenshots show, and it assumes zero commission and zero slippage.
- Add slippage. Set slippage to 2 ticks ($0.02 a share). Each round trip has two fills, so the cost is $0.02 × 2 × 100 = $4 a trade, or $192 over 48 trades. Net falls to $958.
- Try a harsher cost. Thin stocks, fast opens and gaps fill worse. At 5 ticks the cost is $10 a trade and net falls to $670. At 10 ticks it is $20 a trade and net falls to $190, about a sixth of the headline.
- Count the trades. Forty-eight trades is a small sample. One or two outsized winners can carry the whole result, so sort the trade list by P/L and remove the best two. If the result turns negative, the signal is two lucky trades plus noise.
- Split the history. Run the first year and the second year separately. A crossover tends to make most of its money in one trending stretch and give some back in the choppy one. If one year carries everything, you have learned which market the signal needs, which is useful, but it is not a signal that works everywhere.
Bar chart of an illustrative 20-SMA crossover test, 48 round trips on 100 shares: net profit $1,150 at zero slippage, $958 at 2 ticks, $670 at 5 ticks, and $190 at 10 ticks of slippage per fill.
The lesson is the shape of the bars. Frequent signals pay their costs frequently, and the cost is fixed per trade while the edge per trade is small. A signal that survives 5 ticks of slippage and the removal of its two best trades has earned a forward test, nothing more. One that only works at the defaults does not exist outside the tester. For the full method, including how many trades a test needs, see how to backtest a trading strategy.
How to test any free signal before you trust it
The worked example generalises into a short checklist that fits any platform.
- Read the rule. If you cannot state the signal in one or two sentences from its code or documentation, you cannot test it honestly. Compiled-only or invite-only scripts fail this step by design.
- Check when it fires. Confirm the signal waits for the bar to close, or watch it live and screenshot each arrow for a week.
- Set costs first. Commission, slippage, and for forex the real spread. Every free tester here defaults to something kinder than your broker.
- Get enough trades. A few dozen trades is a start; a hundred or more across rising, falling and sideways markets is a sample you can learn from.
- Remove the best trades. If the result depends on one or two, write that down.
- Forward test on paper. Run the signal live on a demo account for weeks, with the same stop and size you would use with real money. Backtests are built with hindsight and fill more kindly than a live market, so expect live results to come in worse.
The forward test is where most signals quietly die, and that is the point of running it. Suppose a signal showed 60% winners in the tester and runs at 45% live: it is not necessarily broken; it may be the same rule meeting real fills and a different market. What you are looking for is whether the live results stay within the range the backtest suggested once costs are in. If they fall well outside it, the backtest was describing something that is no longer there, or never was.
Size the first real trades small. Even after passing every step above, a signal can still have a losing month, and the first live month is the one most likely to expose a cost or fill you did not model. Our guide to risk management in trading covers how much of an account a single trade should put at risk.
Red flags in "free" and paid signal services
Free signal software and signal services are different products, and the services are where people lose money fastest. In January 2024 the CFTC issued an advisory, announced in press release 8854-24, warning that fraudsters were using interest in AI to sell "algorithms that automatically place trades, known as 'bots,'" and "algorithms that provide buy and sell signals to subscribers." Its core point: "AI technology can't predict the future or sudden market changes." The release cites Mirror Trading International, which allegedly took more than $1.7 billion in bitcoin from at least 23,000 people over about three years while promising at least 10% a month.
The release names the red flags directly. Claims of high or guaranteed returns are a red flag of fraud. Strangers promoting such claims online should be ignored. Hype around AI deserves extra suspicion when it comes from social media influencers. Add a few that come up with signal scripts in particular:
- A win rate with no trade count, costs or date range. "87% accurate" means nothing without the sample and the settings.
- Screenshots of history only. If the seller cannot show arrows appearing live, assume they repaint.
- Invite-only access to a script you cannot read, sold by subscription through a Discord or Telegram link.
- Signals that change the strategy for you. A script that "picks the best strategy for each ticker" has been fitted to each ticker's past, and the fit is the part least likely to carry forward.
- Urgency. A countdown, a limited number of seats, a price that rises tomorrow.
Free software with published code avoids most of these by construction. You can read the rule, run it, and watch it live without paying anyone. That is the strongest argument for starting with the free platforms above, and for staying suspicious of any signal that asks to be trusted before it can be tested.
Where Quant AI fits
Quant AI does not print buy and sell arrows, and it does not tell you when to trade. It reads a screenshot of a stock, crypto or forex chart and marks the trend, the support and resistance levels, and the patterns it finds. Used next to a signal script, it is a second read on the chart behind the arrow: when a buy fires, take a screenshot and check whether the app sees the same trend and where it puts the nearest resistance. A buy signal two percent under a level the app marks is a trade with little room to run.
It will not tell you whether a signal is profitable. Only a test with costs, enough trades, and a forward run on paper can do that.
How to choose
- You want the most signal scripts to try: TradingView Basic, and upgrade only when the 2-indicator limit blocks a filter you have tested.
- You want to audit every trade a signal would have taken: thinkorswim, through the Strategy Report.
- You want a signal to place orders on its own: MetaTrader 5 with an Expert Advisor whose source you can read, tested in its Strategy Tester first.
- You trade futures and want signals with a simulator: NinjaTrader.
- You are shopping for a paid signal service: read the CFTC release first, then demand a trade count, costs, and live records you can verify.
Frequently asked questions
Which free software gives buy and sell signals?
TradingView's free Basic plan, through built-in strategies and community scripts; thinkorswim, through strategies built with AddOrder; MetaTrader 5, through built-in and custom indicators and Expert Advisors; and NinjaTrader for futures. All four are free to chart, with limits set by plan or by broker account.
Are buy and sell signal indicators accurate?
An indicator is as accurate as the rule inside it in the market you use it on, and that changes over time. A crossover can do well through a trend and lose steadily in a range. Judge a signal on a test with costs and enough trades, never on a win rate quoted by its seller.
Do TradingView buy sell indicators repaint?
Some do and some do not. Scripts that signal on the unfinished bar, plot pivots back in time, or use lookahead on higher timeframes can show history that live trading would not have produced. Check the code for barstate.isconfirmed, or watch the script live for a week and compare.
Is there an app that tells you when to buy and sell stocks?
Many apps sell that promise. What any of them can actually give you is a rule's output, and the CFTC warns that tools claiming to predict the market, especially with AI, are a common fraud pitch. Use signals as a starting point for your own analysis, with your own stop and size.
Are MT5 signals free?
The MetaTrader 5 platform and its indicators are free. The Signals service, which copies another trader's trades into your account, works on a subscription price set by each provider.
Can I make my own buy sell indicator with ChatGPT or Claude?
You can ask an AI model to write Pine Script or thinkScript for a rule you describe, and it will often produce working code. It cannot make the signal accurate. Read the code it writes for repainting (signals on the open bar, lookahead), then test it with costs like any other script.
Can free signals trade automatically?
On MetaTrader 5, an Expert Advisor can place orders on its own. Thinkorswim strategies cannot send real orders. TradingView alerts can be sent to some brokers or services, but automating an untested signal only makes it lose faster.
The bottom line
The best free technical analysis software with buy sell signals is TradingView for range of scripts, thinkorswim for auditing every trade, MetaTrader 5 for automation, and NinjaTrader for futures. The software is free; testing the signal is your job. Confirm the arrow waits for the bar to close, add realistic costs, count the trades, and run it on paper before any real money follows it. Trading carries risk of loss, and no signal, free or paid, changes that.