TradingView Stock Scanner: How to Set Up the Screener and Pine Screener (2026 Guide)
Where the TradingView stock scanner lives, which data feed its rows use, three worked screens, and the Pine Screener's real limits before you trust a list.
The TradingView stock scanner is the Stock Screener, under Products, then Screeners, in the top menu. It works on the free Basic plan, refreshes its table every 10 seconds or every minute, and for US stocks it reads real-time data from Cboe by default. For conditions built from your own indicator, there is a second tool, the Pine Screener. Both are refreshing screeners: they redraw a list on a timer. Neither pushes you an alert the moment a stock breaks a level, and that difference decides what you can use them for.
This guide covers where everything sits, the data question you need to settle before trusting any row, three screens worked through from filter to chart, what the Pine Screener can and cannot run, and where the tool falls short for day trading.
Screener or scanner: what TradingView actually gives you
Traders use the two words loosely, but they describe different machines. A screener applies filters to a universe of stocks and shows you the ones that pass, as of the last refresh. A scanner, in the strict sense, watches a stream of trades and tells you when something happens: a new high of day, a volume spike, a halt.
TradingView's tool is a screener with a fast refresh. Its help center lists three auto-refresh settings: every 10 seconds, every 1 minute, or never. At the fastest setting, a row can be up to 10 seconds old before the table redraws. For a swing trader screening after the close, that is irrelevant. For someone trying to catch the first push off a premarket high, 10 seconds is the whole move on a fast small cap.
So the honest answer to "is the TradingView stock scanner good enough" depends on the job. For building a watchlist, screening end-of-day setups, and finding which names to put on a chart, it does well, mostly because the chart is one click away. For event-driven day trading, where the alert has to arrive within a second or two of the trigger, you need a streaming scanner, and we compared those in the best stock scanners for day trading.
Where the screener lives and how it is laid out
There are two ways in. Open the Products menu in the top navigation, choose Screeners, and pick the one you want. Or open it from the right-hand toolbar on any chart page, which is faster once you are working.
TradingView lists separate screeners for stocks, ETFs, bonds, crypto coins, centralized exchange pairs, and decentralized exchange pairs, plus the Pine Screener. The switcher in the top-left corner moves between them. Everything below applies to the Stock Screener unless it says Pine.
The layout has four parts worth knowing by name.
The Screens menu is where you save, copy, rename, and reopen screens. It also exports results to CSV and keeps the five screens you used most recently. Save every screen you build. Rebuilding a seven-filter screen from memory each morning is how filters drift without you noticing.
The filter panel runs across the top. You can start from one of TradingView's popular screens or add filters yourself from categories such as security info, market data, and technicals. Each filter opens with preset ranges, and Manual setup lets you type an exact threshold. The region selector on the left applies to the stock and ETF screeners only.
The table is the results grid. Column sets come ready-made, and the plus sign adds your own. Click a header to sort. Right-click a column to change its sorting, move it, or remove it. The column you sort by matters more than people expect, because most traders only look at the top ten rows.
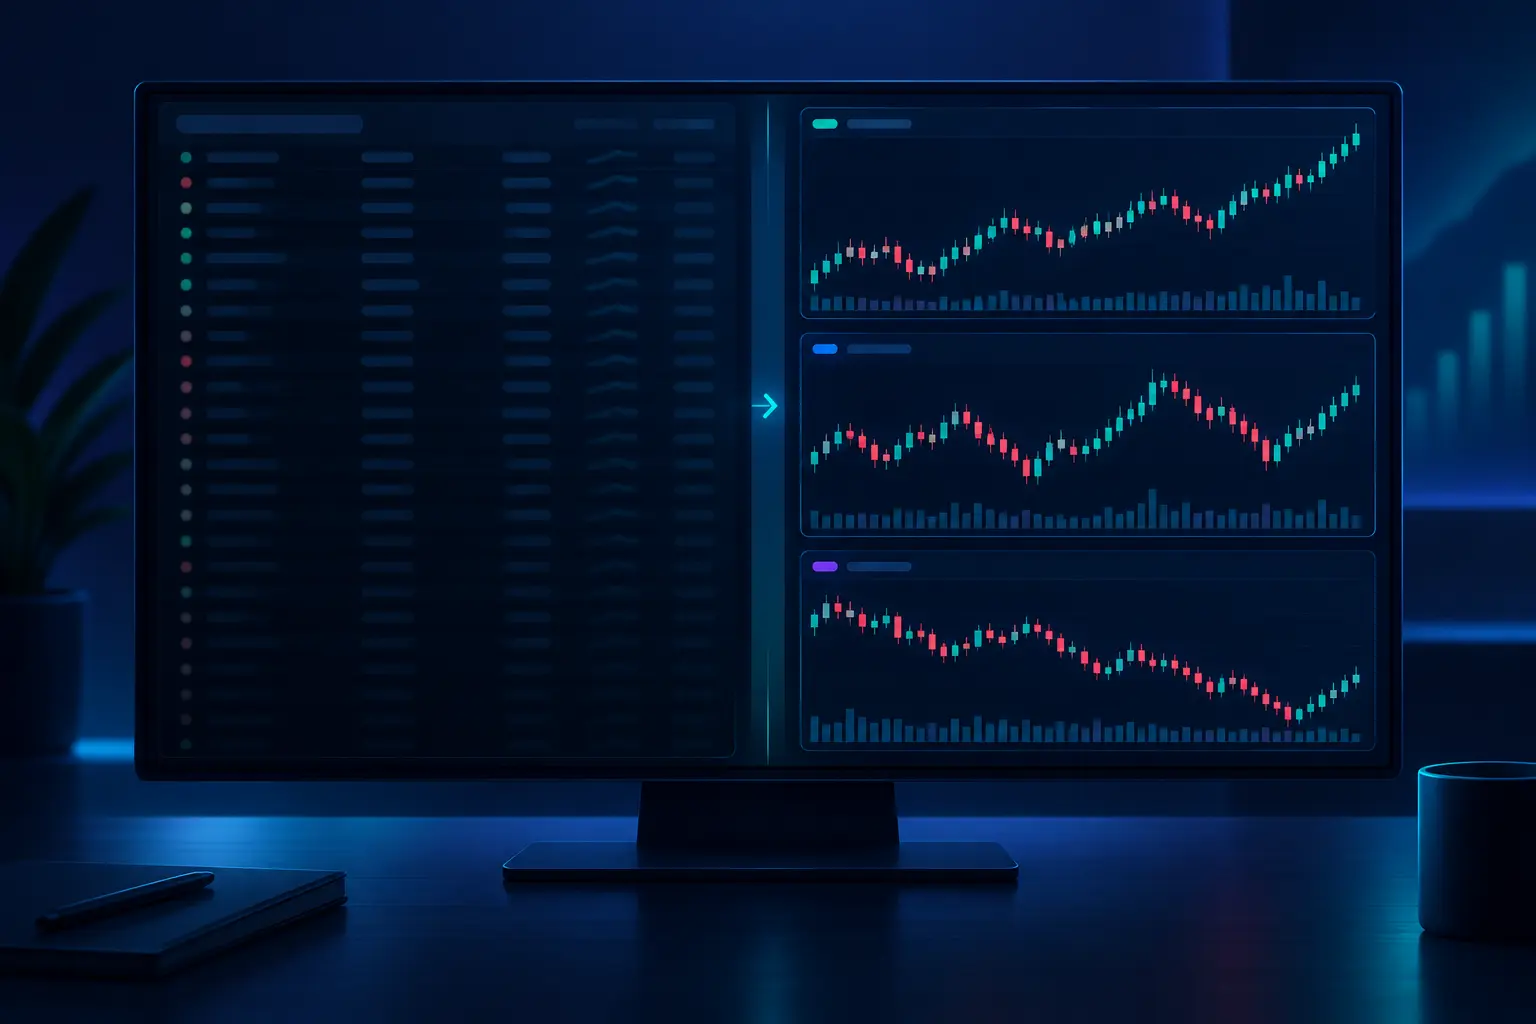
The chart view toggle in the upper-left turns the table into a grid of small charts, with your choice of chart type, timeframe, and grid layout. This is the feature that makes TradingView's screener worth using over a standalone one. You can look at the shape of twenty candidates in the time it takes to read five rows of numbers.
The settings menu holds the auto-refresh choice and, for stock and ETF screeners, the currency used for financial data.
Settle the data feed before you trust a row
Every number in the table comes from a data feed, and on TradingView the default feed for US stocks is not the full market.
TradingView's support article on US stock data says its charts show real-time data from Cboe by default, which carries no per-user exchange fee. That article puts Cboe's share of US stock trading at over 25%. The same page explains the catch: Cboe's volume is lower than the primary exchanges', so it sends fewer price updates. The differences show most on short timeframes such as 1-minute charts, on less active tickers, and in premarket and after-hours sessions. TradingView's suggested fix is to buy real-time data from the primary exchanges, NASDAQ, NYSE, or NYSE Arca. You can read the details in TradingView's article on whether US stock data is free by default.
The feed itself is Cboe's four US equity exchanges, BZX, BYX, EDGX, and EDGA, which Cboe's market data page describes as a unified view under one license. That is a large slice of the market and still a slice.
Here is where the support pages run out. The article describes charts and does not say whether screener columns such as volume or premarket change are computed from the same Cboe-only stream. We could not find a TradingView page that answers that. Treat it as unknown and check it yourself: pick a busy premarket name from your screen, and compare the screener's volume with the figure your broker shows. If they differ by a wide margin, your volume and relative-volume filters are reading a partial tape, and a premarket gap screen will rank names on incomplete numbers.
Paying for TradingView does not fix this on its own. The pricing page lists real-time data as a separate purchase that needs a paid plan, and caps how many market data subscriptions each plan can hold: two on Essential, four on Plus, six on Premium, unlimited on Ultimate. TradingView's own help page on market data is blunt that "our paid plans don't cover those fees even if you have an active TradingView subscription."
Outside the US the picture changes again. TradingView's heatmap help page says that without a real-time subscription, "symbol data will be provided with a delay of 15 minutes." Many non-US exchanges fall under that rule. A screen on a delayed exchange is showing you the market as it was a quarter of an hour ago, whatever the refresh is set to.
Bar chart of the worst-case age of a screener row, in seconds, under four setups. Real-time feed with a 10-second refresh: 10 seconds. Real-time feed with a 1-minute refresh: 60 seconds. 15-minute delayed feed with a 10-second refresh: 910 seconds. 15-minute delayed feed with a 1-minute refresh: 960 seconds. The refresh setting barely matters once the feed itself is delayed.
How to build your first screen, step by step
Build the screen for one job. A screen that tries to find swing pullbacks and premarket gappers at once returns a list that is good for neither.
- Open the Stock Screener and set the region to the market you trade.
- Write down, before you touch a filter, what a good candidate looks like on the chart. "Above its rising 50-day average, pulled back to it, on lighter volume" is a description you can turn into filters. "Something that will go up" is not.
- Add the crude filters first: price range and average volume. They cut the universe from thousands of names to hundreds in one step, and they remove the stocks you could not trade in size anyway.
- Add the filters that describe the setup: moving average relationships, change from the open, relative volume, or a technical rating.
- Sort by the one column that best ranks your idea. For a pullback screen that might be distance from the 50-day average. For a gap screen, premarket change in percent.
- Save the screen with a name that says what it finds and on which timeframe.
- Switch to chart view and look at every survivor before you trust the screen. If half the charts do not look like your written description, a filter is wrong. Fix the filter instead of filtering the charts in your head.
- Send the keepers to a watchlist. TradingView's walkthrough lists sending screener results to a watchlist as a built-in step, and the watchlist is where alerts live.
Step 7 is the one people skip, and it is the one that tells you whether the screen works. The day trading scanner setup guide has the filter-by-filter numbers traders use for price, float, relative volume, and ATR. This guide stays with the TradingView mechanics.
Three worked screens
The thresholds below are illustrations of how to translate an idea into TradingView's filters. They are starting points to test against your own charts and come with no tested performance figures attached.
An end-of-day swing pullback screen
The idea: liquid stocks in an uptrend that have pulled back toward a rising average. You run it after the close, so data latency does not matter at all, which makes this the best fit for TradingView's screener.
- Price above $10
- Average volume (30-day) above 1 million shares
- Price above the 200-day simple moving average
- 50-day simple moving average above the 200-day
- Price within about 3% of the 50-day average
- Sort by change over the last week, lowest first
On a typical evening a screen like this might return 25 to 60 names, depending on the market. Chart view does the rest. You are looking for an orderly pullback into the average on shrinking volume. A gap down through the average on heavy volume passes the same filters and is a different situation entirely. That is the judgment the filter cannot make. Our guide to how to identify a trend covers reading which one you are looking at.
A premarket gap screen
The idea: stocks moving before the open on real volume, ranked by the size of the gap.
- Price between $2 and $50, or whatever range your account can trade
- Premarket change above 4%
- Premarket volume above a floor you set after a few weeks of watching, often 100,000 shares or more
- Sort by premarket change, highest first
- Auto-refresh set to every 10 seconds
This is the screen where the data section above matters most. Premarket is the session TradingView's own support page names as the one where the default Cboe feed differs most from primary-exchange data. Run the broker comparison before you rely on the volume column here. If you trade from this screen, the list is a menu for the open. The entry decision still happens on a live chart, on a feed you trust.
A post-earnings drift screen
The idea: stocks that reported recently and closed strong on heavy volume, which some traders watch for continuation over the next sessions.
- Recent earnings date within the last five trading days
- Change on the day above 5%
- Relative volume above 2
- Price above $10 and average volume above 500,000
- Sort by relative volume, highest first
This one is a good test of the fundamentals side of the screener, since the earnings fields sit next to the technical ones. It is also a good test of discipline. A big earnings gap often gets a sharp first-day move and then chops for weeks. The screen finds the event, and whether it continues is a chart question, not a screen question.
From list to chart: chart view, watchlists, and alerts
A screen produces a list. Turning that list into a few trades is a separate workflow, and TradingView's strength is that the steps live in one place.
Start in chart view. Set the grid timeframe to the one you trade, daily for swing screens and 5-minute for intraday. Twelve small charts on one screen will show you in a few seconds which names are trending, which are ranging, and which are a single spike on nothing. Delete the ones that fail your written description.
Send the survivors to a dedicated watchlist. Then you have a choice about alerts, and the plan you are on decides it.
TradingView's watchlist alerts let one alert cover every symbol on a list, including symbols you add later. Its blog post announcing them lists two active watchlist alerts on Premium, up to 10 on Expert, and up to 15 on Ultimate. The current pricing page shows zero watchlist alerts on Essential and Plus. On those plans you set alerts per symbol, against the price and technical alert counts each plan carries: 20 each on Essential, 100 on Plus, 400 on Premium, 1,000 on Ultimate, and three price alerts on the free plan.
Three price alerts is the limit that ends most free-plan workflows. If your evening screen leaves you with eight names and two levels each, that is 16 alerts, and the free plan covers three of them. The rest you would have to watch by hand.
When you set alerts from a screen, set them on the level that matters on the chart, such as the prior high or the moving average the pullback is testing, and leave the screen's own thresholds out of it. A screen threshold is a rough cut. A chart level is where the trade's risk is defined. Our guide to reading support and resistance covers picking those levels.
The Pine Screener, for conditions the standard screener cannot express
The standard screener only filters on columns TradingView has already computed. If your setup depends on your own indicator, a custom moving average ribbon, or a condition across two timeframes, the Pine Screener is the tool for it.
It works differently. You pick a source, either a watchlist or an index, and one indicator. The screener runs that indicator on every symbol in the source and lets you filter on the indicator's plotted values or alert conditions. The Pine Screener entry under Products, then Screeners, is where you open it. TradingView's help center article on it does not name the plan required. If the page asks you to upgrade, your plan does not include it.
The rules are specific, and they explain most of the "my script will not run" complaints. These come from TradingView's Pine Screener requirements page:
- One source at a time. Picking a new one replaces the old one.
- Indices work as a source up to 4,000 symbols.
- One indicator per screen.
- The indicator calculates on the last 500 bars only. A 200-period average on daily bars fits. Anything that needs a long history, such as a multi-year high, may not compute the way it does on your chart.
- Timeframes are limited to 1, 5, 15, and 30 minutes, 1, 2, and 4 hours, 1 day, 1 week, and 1 month. Custom timeframes are not supported.
- Indicator-on-indicator setups are not supported, and neither are strategies, patterns, or the Financials category.
- The indicator needs at least one plot or an alertcondition() to filter on. The first ten plots become filter options and table columns.
- input.timeframe(), input.symbol(), and input.time() are ignored. The screener uses the script's defaults for those.
- Only one scan runs at a time, even across browser tabs.
- Changing the source, indicator, inputs, timeframe, or filters needs a rescan.
The biggest recent change is in requests for other data. TradingView's blog announced that the Pine Screener now allows up to 40 request calls per script, up from 5, matching what charts already allowed. Each request for data the script does not already have, such as another timeframe or an index, counts as one call. Identical calls count once, and calls inside imported libraries count toward the limit.
A worked Pine Screener example: daily trend, 4-hour pullback
Here is a condition the standard screener cannot express directly: the daily chart is in an uptrend, and the 4-hour chart has pulled back to its own 20-period average.
You would write one indicator that runs on the 4-hour timeframe, requests the daily 50-period and 200-period averages, and plots two values: a 1 when the daily 50 is above the daily 200, and the 4-hour close's distance from its 20-period average in percent. That is two request calls, well inside the limit of 40. You also add an alertcondition() for when both are true, so the screener has a filter to offer.
Run it on a watchlist of 150 liquid names or on an index. Filter for the trend plot equal to 1 and the distance between 0% and 1.5%. Before the 40-call change, a script that also compared each stock's daily return against an index on two timeframes could hit the old cap of 5. It now fits.
Two cautions. The screener calculates on the last 500 bars, so a script with long lookbacks can compute on a shorter history than it does on your chart. Open a few results on the full chart and check that the plotted values match before you trust the list. And a passing row only means the arithmetic is true. Whether the pullback is orderly or the start of a breakdown is still a chart-reading call.
What the TradingView screener does badly
Using any tool well means knowing where it stops. These are the limits that matter in practice.
The help center's walkthrough of the standard screener lists no alert that fires when a stock enters a screen. It covers saving, exporting, refreshing, and sending results to a watchlist, and names only general price alerts among the related tools. If you need "tell me the second something on this list makes a new high of day", the workaround is a watchlist alert on Premium or above, or a dedicated scanner.
The refresh floor is 10 seconds. Momentum traders will find that slow, and the table does not tell you which rows changed since the last redraw.
The default feed is Cboe's share of the market. On US stocks that is real-time and free, and also thinner, most of all in premarket.
The free plan exports screener data on daily, weekly, and monthly timeframes only, per the pricing page, and gives you two indicators per chart and three price alerts. If you chart with a 9 and 20 EMA plus VWAP, you are over the indicator limit before you start.
The Pine Screener runs one script on one source at a time, on 500 bars, and only one scan can run at once. Covering a large custom universe across several setups means queueing scans by hand.
None of these make the screener bad. For the swing pullback screen above, none of them matter. For a premarket gap trader with a small account, all of them do.
Common mistakes
- Trusting the premarket volume column without checking it against your broker. Run the comparison once on a busy name. It takes two minutes and tells you whether your volume filters work.
- Paying for a plan upgrade and expecting real-time primary-exchange data. The plan and the data are separate purchases.
- Building one screen for every setup. One screen, one job, one sort column.
- Sorting by percent change and reading only the top rows. The top of a gainers list is usually the thinnest, most halt-prone stock on the board.
- Never opening chart view. A screen that has not been checked against the charts it returns is untested.
- Letting a screen's filter stand in for a stop. A filter threshold says a stock qualified. A stop says where you are wrong, and only the chart can tell you where that is.
- Treating a screen as a signal. The SEC's day trading guide warns that "day traders typically suffer severe financial losses in their first months of trading." A cleaner list does not change the odds on any one trade.
Frequently asked questions
Is the TradingView stock screener free?
Yes. The screener works on the free Basic plan. The limits you hit are elsewhere: two indicators per chart, three price alerts, and screener export on daily, weekly, and monthly timeframes only.
Is the TradingView screener real-time?
For US stocks, the default data is real-time from Cboe, which TradingView says handles over 25% of US stock trading. It sends fewer updates than the primary exchanges, and the gap is widest in premarket and after-hours. Many non-US exchanges are delayed 15 minutes unless you buy their data.
How often does the TradingView screener refresh?
You choose: every 10 seconds, every minute, or never. The setting is in the screener's settings menu.
Can TradingView alert me when a stock enters my screen?
The help center walkthrough for the standard screener does not list screen-based alerts. The practical route is to send results to a watchlist and use watchlist alerts, which the pricing page lists on Premium and Ultimate, or set per-symbol alerts on lower plans.
What is the difference between the Stock Screener and the Pine Screener?
The Stock Screener filters on columns TradingView has computed, such as price, volume, moving averages, and fundamentals. The Pine Screener runs one indicator of your choice, including your own Pine scripts, across a watchlist or index, and filters on what that indicator plots.
Why will my script not run in the Pine Screener?
The usual causes are on TradingView's requirements page: the script has no plot or alertcondition() to filter on, it depends on another indicator's output, it uses a timeframe outside the supported list, it is a strategy, or it relies on input.timeframe() or input.symbol(), which the screener ignores.
How many symbols can the Pine Screener scan?
An index source is supported up to 4,000 symbols. Watchlists can mix stocks, crypto, and other asset types.
Where Quant AI fits
A screen gets you from thousands of tickers to a handful worth opening. What it cannot do is look at those charts and tell you whether the pullback is orderly, where the nearest support sits, or where a stop would go. That part is still chart reading, and the price action guide is where to build it.
Quant AI picks up at that step. Screenshot a chart from your shortlist and it reads the trend, marks the support and resistance levels it finds, and flags the patterns on the chart. It will not tell you whether to take the trade, and it reads the chart you give it, so a chart on a thin feed gets read as drawn. It saves the first pass on the twelve names your screen returned, so your attention goes to the three that deserve it.