How to Use the Yahoo Finance Stock Screener: Presets, Filters, and Limits (2026 Guide)
Where the Yahoo Finance stock screener lives, what each preset really filters, the data delays behind the rows, three worked screens, and what the free version cannot do.
The Yahoo Finance stock screener sits under the Research tab, in Screeners. It is free with a Yahoo account, it comes with a page of ready-made screens such as Most Active Stocks and Undervalued Growth Stocks, and it lets you build and save your own from fundamental and price filters. People search for it as a "Yahoo Finance scanner", but it is a screener: it filters a list when you load it, and it does not alert you the moment something happens. That makes it good for finding names to study and weak for catching a move in progress.
This guide covers where the screener lives, what each preset actually filters, how stale the data behind a row can be, three screens worked end to end, and the step every screener leaves to you, which is opening the chart.
What the Yahoo Finance stock screener is good for
A screener applies filters to a universe of stocks and returns the ones that pass at the moment you load it. A scanner, in the strict sense, watches the live tape and fires when a condition triggers: a new high of day, a volume burst, a halt. Yahoo's help page describes its tool plainly as "filters that help you find investments based on specific criteria, like price and industry", and that is the right mental model.
So the honest job description is narrow. The Yahoo Finance screener is good at three things:
- Building a watchlist from fundamentals: earnings growth, valuation ratios, market cap, sector.
- Pulling the day's movers after the fact, so you can study what moved and why.
- Giving a beginner a set of named starting points without learning a filter language.
It is poor at intraday trading. Nothing in the free screener pushes a notification when a stock crosses a level, and the presets are lists you refresh by reloading the page. If you trade the open, you need a streaming tool, and we compared those in the best stock scanners for day trading. If you want a stack of free tools that covers the gaps, the best free stock screener apps puts Yahoo next to Finviz, TradingView, and broker scanners.
Where to find it and how to save a screen
Yahoo's help article on creating and using screeners gives the desktop path in eight steps, and they match what the site shows today:
- Sign in to Yahoo Finance. Saving needs an account; browsing presets does not.
- Click the Research tab.
- Click Screeners.
- Click Create.
- Select the screener type. Yahoo supports stocks, mutual funds, and ETFs.
- Set your filters and click Apply.
- Click Save.
- Give the screen a name and click Save again.
The mobile browser path is the same with one extra tap on the Menu icon first. The help page says you can choose "from dozens of key statistics, financial highlights, and valuation measure filters", and the screener page itself adds price change and volume to that list.
Name your screens by their rules. "SmallCap-EPSgrowth25-PE20" tells you in six months what the screen does; "Monday picks" does not. Once you have three or four saved screens with vague names, you start editing the wrong one, and a filter you tightened for a test quietly becomes your default.
One practical point about layout. The screener table can feel cramped next to the ads and the dock on the right side. Yahoo shows a "Maximize screen space" prompt that closes the dock for a wider table; use it before you start sorting columns, or the column you care about may sit off screen.
The preset screeners, read honestly
Before building anything, look at the presets, because most people who search for the Yahoo Finance scanner want one of them. Here is what the Yahoo Finance screeners page says each one does, in Yahoo's own words, and what that means in practice.
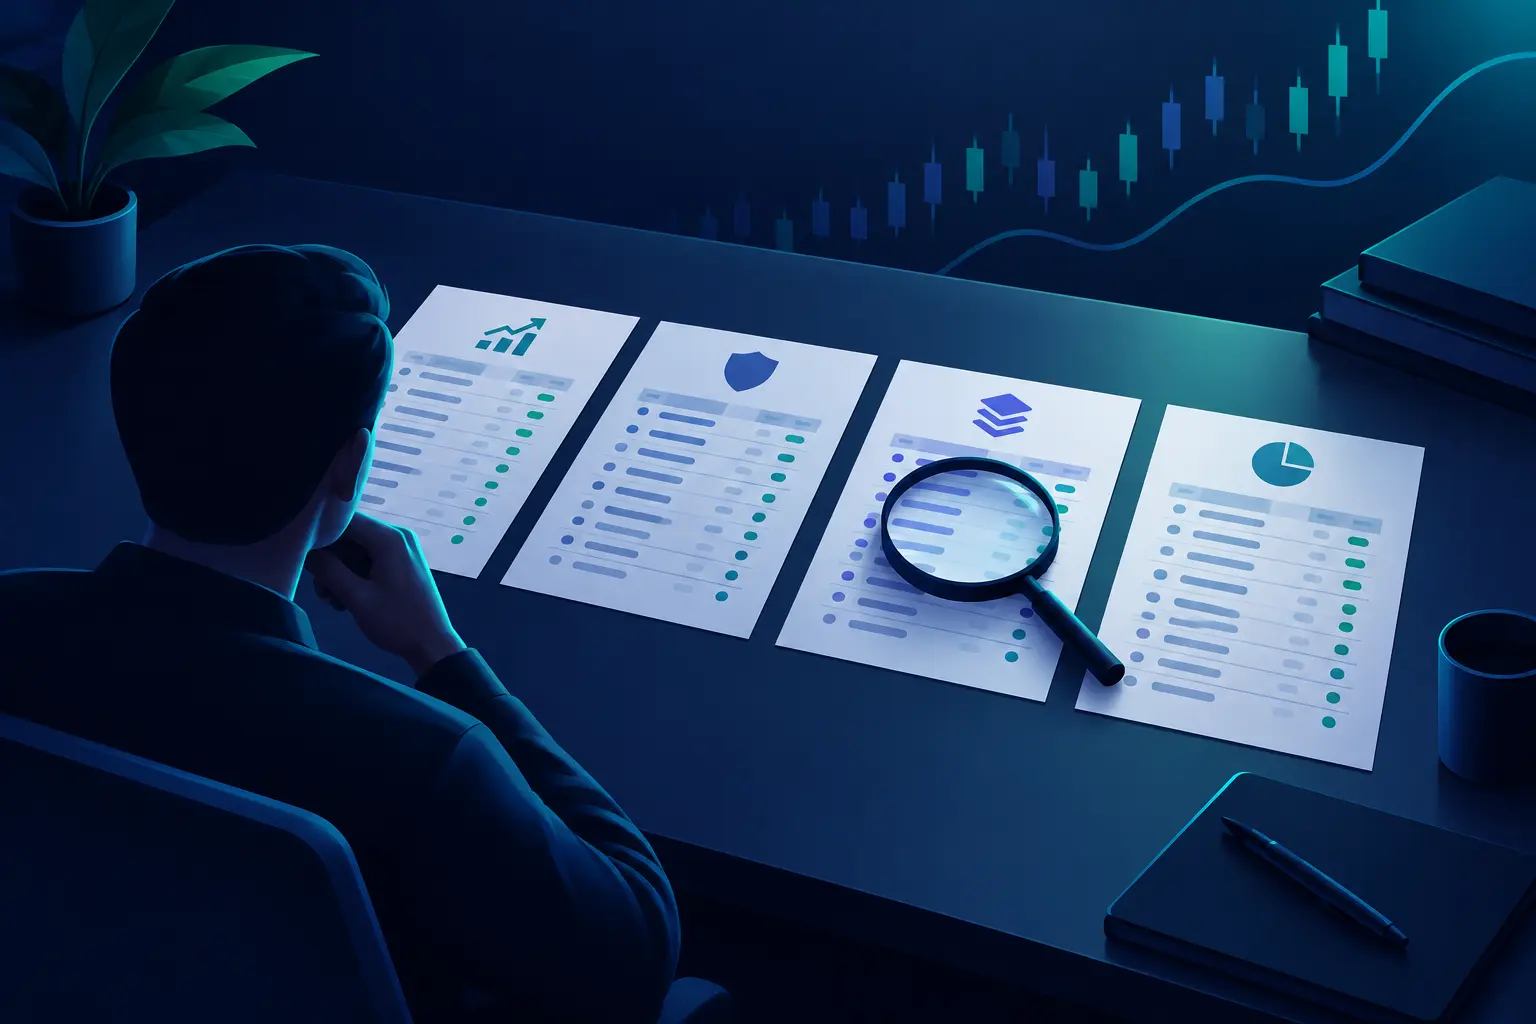
Most Active Stocks lists "the most traded equities in the trading day." Volume rank only. It tells you where the attention is today, which helps with liquidity and says nothing about direction.
Most Active Penny Stocks covers "stocks priced at $5 or less with the highest daily volume and high % day change." This is the list to treat with the most suspicion. Low-priced, high-volume, big-percentage movers are where pump schemes and dilution-driven spikes live, and spreads on these names can eat a small account's edge on entry alone.
Undervalued Growth Stocks is defined as "stocks with earnings growth rates better than 25% and relatively low PE and PEG ratios." That is the most useful preset for swing and position traders, because it combines a growth filter with a valuation filter. Note the word "relatively": you are not told the exact PE and PEG cutoffs, so you cannot assume the list means cheap in any absolute sense.
Day Gainer Stocks and Day Loser Stocks are the equities "with the greatest gains" or "greatest losses in the trading day." Percent-change rank, nothing more.
Aggressive Small Caps are "small cap stocks with high earnings growth rates." Small Cap Gainers are "small cap stocks with percent change greater than 5%."
Recent 52-Week Highs and Recent 52-Week Lows are stocks that set a new 52-week extreme "within the last week." For trend followers this is one of the better free lists in any screener, because a fresh 52-week high is a mechanical, checkable fact.
Most Shorted Stocks shows "stocks with the highest short interest positions from Nasdaq and NYSE reports released every two weeks." Hold that phrase in mind. It matters in the limits section below.
There are also fund presets (Top Mutual Funds, Portfolio Anchors, High-Yield Bonds and others) built on a "Performance Rating of 4 & 5." Those belong to a different job, picking funds, and this guide leaves them alone.
The pattern across all of these: each preset is one or two rules. None of them reads a chart, none checks where price sits against support, and none knows whether the move is the first day or the fifth. That is your work after the list loads.
Check the data delay before you trust a row
Yahoo publishes a table of exchanges, data providers, and delays, and it is worth reading once before you use any price-based screen. For US markets, the table lists the Nasdaq Stock Exchange as real-time, with ICE Data Services as the provider. Several other feeds carry delays: Cboe indices, NYSE indices, OTC Markets, and the options feed from OPRA are 15 minutes behind, CME and CBOT futures are 10 minutes, and NYMEX, COMEX, and ICE Futures US are 30 minutes.
Bar chart of the data delays Yahoo Finance lists for selected US feeds: Nasdaq Stock Exchange real-time (0 minutes), CME futures 10 minutes, CBOT futures 10 minutes, Cboe indices 15 minutes, OPRA options 15 minutes, OTC Markets 15 minutes, NYMEX futures 30 minutes, ICE Futures US 30 minutes.
Two consequences for screening. First, a price or percent-change screen on a delayed feed is screening the past. A Day Gainers row on a 15-minute-delayed OTC name can show a stock up 22% that has already given half of it back. Second, the same page carries Yahoo's own disclaimer that data on the site "is provided for informational purposes only, and is not intended for trading or investing purposes." Take that at face value: confirm the price in your broker before you place anything.
The fundamental filters age differently. Earnings growth, PE, and revenue figures update when new filings and estimates come in, which means quarterly. A screen built on them is fine to run once a week; running it every hour adds nothing.
Three worked screens
The numbers in these examples are illustrations of how to read a result, not measured outcomes. Your list will look different on the day you run it.
Screen 1: a swing watchlist from fresh 52-week highs
Start with the Recent 52-Week Highs preset. On a strong market day it can return a long list, so narrow it. Open it in the editor, then add a market-cap floor so you skip the thinnest names, and an average-volume floor so you can get in and out without moving the price. Save it as "52wkHigh-MidCapPlus-Vol".
Then sort by percent change and read the top twenty. You are not looking for the biggest movers. You are looking for names that made the new high on a quiet, orderly climb, because a stock that gapped 15% to a new high on news has a different risk profile from one that pushed up 1% a day for two weeks. The screener cannot tell those apart. The chart can, in about five seconds each.
Suppose you are left with eight names. For each one, mark the old high the stock just broke. That level is your first reference: if a pullback holds above it, the breakout is intact, and if price closes back under it, the setup has failed. Our guide on how to read support and resistance covers why a broken high often becomes the line price tests next.
Screen 2: the Undervalued Growth list, checked by hand
Load Undervalued Growth Stocks. Because Yahoo describes its PE and PEG thresholds only as "relatively low", treat the list as a starting set and add your own explicit filters on top. A reasonable version for a first pass: earnings growth above 25% (Yahoo's own preset rule), a PE ceiling you choose and write down, and a market-cap floor.
Now do the part the screen skips. Open each company's earnings history. A 25% growth rate built on one quarter that rebounded from a terrible year is not the same as three years of steady growth, and both pass the filter. Then open the chart and check the trend. A stock that is cheap on PE and in a downtrend on every timeframe is often cheap for a reason the filters cannot see, and the trend guide has the checklist for calling the direction before you buy anything that looks like value.
Suppose twelve names pass the filters, five have steady multi-year growth, and two of those five are in an uptrend on the weekly chart. Two names to study is a good result. A screen that returns 300 names has not done its job yet.
Screen 3: Day Gainers as a next-day study list
Load Day Gainer Stocks after the close, not during the session. Add a price floor of $5 to exclude the penny-stock churn, and an average-volume floor. Save it.
You are not trying to buy these the next morning. You are building a list of stocks that just had a reason to move, then checking which ones closed near the high of the day and which ones faded. A stock that rallied 9% and closed at the top of its range has buyers still in control. One that was up 14% at midday and closed up 4% has a long upper wick, which means sellers took over. The screener ranks both by the closing percent change and shows you nothing about the path.
From list to chart: the step the screener skips
Every screen above ends the same way: a short list, then a chart for each name. That is the part where most of the decision happens, and the Yahoo Finance screener is not built for it. Its strength is the table. To read a chart you click the ticker, land on the quote page, and open the chart there, one name at a time.
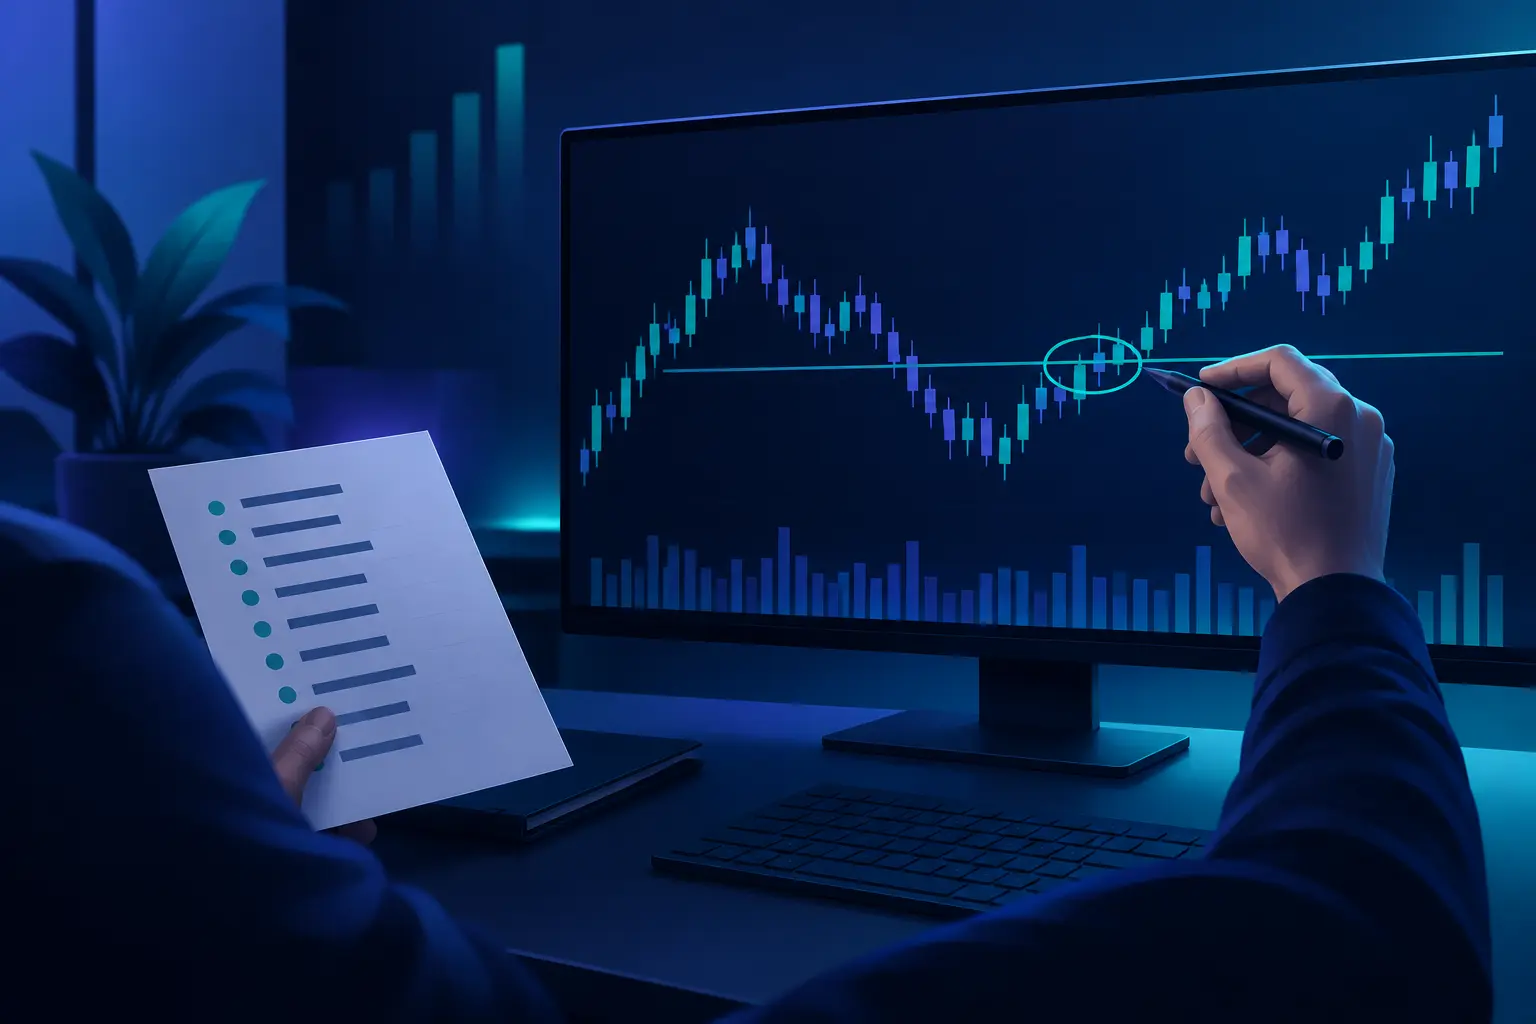
A practical routine that keeps this fast:
- Run the saved screen and add every result to a Yahoo watchlist. Yahoo keeps watchlists under My Portfolio, so the list survives after you close the screen.
- Open each name on a daily chart first. Mark the trend direction and the nearest support and resistance.
- Drop anything where you cannot name an entry, a stop, and a reason in one sentence.
- Move the survivors, usually three to five names, into the charting tool you trade from.
Step 3 is where a screener list becomes a trading list. If you cannot say where you would be wrong, you do not have a setup yet. Our 7-step chart routine is a fuller version of steps 2 and 3, and it works the same on any chart platform.
Expect most names to fail step 3. That is the screen working. A filter on fundamentals or percent change has no idea whether price is sitting under a wall of resistance a dollar above, and that is often the difference between a trade with room to run and one that stalls on day one.
Free versus paid: what Yahoo Finance Gold adds
The basic screener and its presets are free. Yahoo sells three paid tiers on its plans page: Bronze at $7.95 a month, Silver at $19.95, and Gold at $39.95, each figure billed yearly ($95.40, $239.40, and $479.40 a year).
The screening features sit at the top tier. The Gold section of that page lists "Premium Screeners", described as "premium filters like analyst ratings, holders, and more", alongside a "Technical Indicators" feature and downloadable data. The plan comparison table marks a "Smart Money Screener" as included in Gold only, and the same table lists "50+ technical chart patterns" among its advanced chart features. The FAQ adds that premium screeners "primarily focus on US equities and non-US equities traded on US exchanges."
Is Gold worth it for screening? For most retail traders, probably not on screening alone. $479.40 a year is well above the cost of the free tools that already cover technical filters, and if your account is small, a subscription is a fixed cost your trading has to earn back before it earns anything. The case for Gold is stronger if you want its 40 years of exportable financial statements for your own fundamental models, which is a research use, not a screening one.
Where the Yahoo Finance scanner falls short
The limits are worth listing plainly, because they decide whether this is the right tool for your style.
No live alerts from the screen. A saved screen is a filter you run. It does not message you when a new stock qualifies. For setups that trigger intraday, you will learn about them late.
Thin technical filtering on the free tier. The filter groups Yahoo lists are key statistics, financial highlights, valuation measures, price change, and volume. Conditions like "price above its 50-day moving average" or "RSI under 30" are what traders usually mean by a technical screen, and Yahoo markets its technical indicators as part of a paid plan. If your screen depends on indicator conditions, a tool built around them will serve you better.
Short interest is a lagging snapshot. The Most Shorted preset is built from reports "released every two weeks", and the timing explains why that matters. FINRA requires brokers to report short interest twice a month, as positions on a designated settlement date, and publishes the data days later. In FINRA's 2026 schedule, positions as of the November 13 settlement date were due November 17 and published November 24.
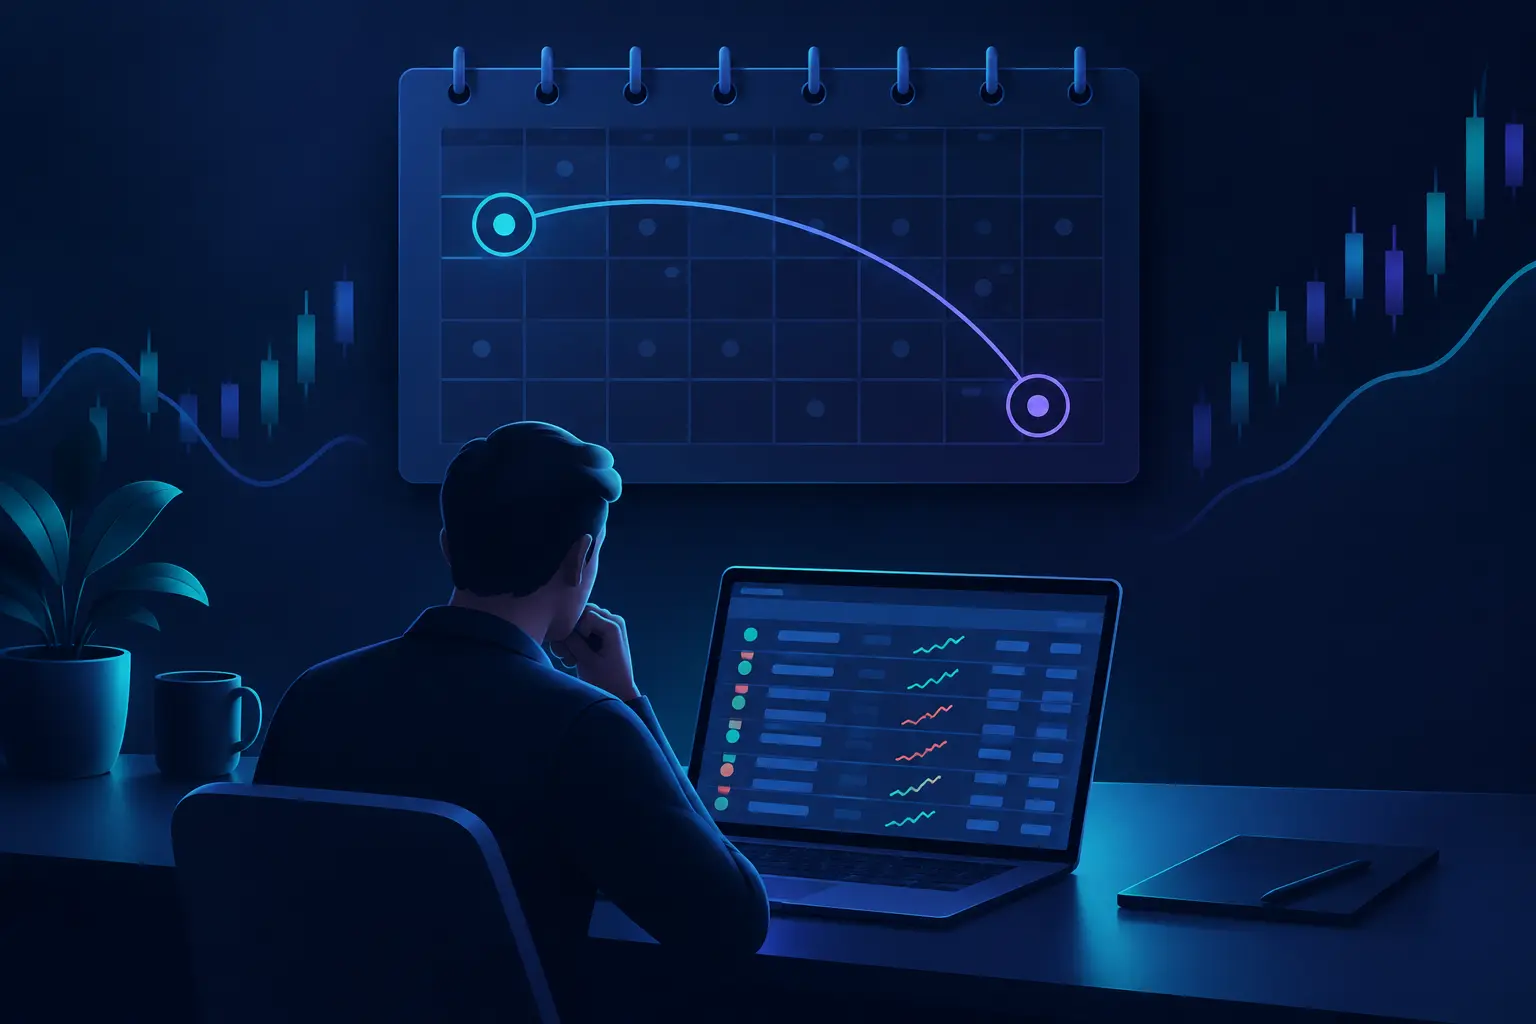
So a Most Shorted list you read on November 20 cannot yet include the November 13 positions; it is still built on the snapshot before that. As FINRA's investor guide to short interest puts it, short interest is "a snapshot of the total open short positions" on a given settlement date. If a heavily shorted stock squeezed in the meantime, the list may show shorts who have already covered. Use it to understand positioning, and do not read it as a live squeeze signal.
Delayed rows on some feeds. Covered above, and worth repeating for anyone screening OTC names, futures, or options: 10 to 30 minutes is a long time on a fast mover.
A cluttered workspace. Ads, news modules, and the dock compete with the table. It is a small thing until you are sorting a 300-row result on a laptop.
Yahoo Finance screener vs Finviz and TradingView
Short version, because we covered both in depth elsewhere.
Finviz has many more filters on one page, including technical ones such as moving-average position and pattern tags, and its free version is delayed. It suits end-of-day swing screening.
TradingView's screener has technical filters, a fast refresh, and the chart one click away, including a chart-grid view of the results. Our TradingView stock scanner guide walks through its setup and its own limits.
Yahoo's edge is simplicity and the presets. A beginner gets a usable Undervalued Growth or 52-Week Highs list in two clicks with no filter syntax. A sensible split is Yahoo for the fundamental side of a watchlist and a charting platform for the technical side.
Common mistakes
- Trading straight off the list. A Day Gainers row is a stock that already moved. Open the chart, find the level, and decide where you would be wrong before you click buy.
- Trusting "undervalued" as a verdict. The preset uses "relatively low" PE and PEG ratios. Add your own explicit thresholds and check the earnings history behind the growth number.
- Ignoring the delay column. Check Yahoo's delay table for the exchange your stock trades on, and confirm the price in your broker.
- Reading Most Shorted as live data. It reflects a settlement date that can be two or more weeks old by the time you read it.
- Leaving penny stocks in a general screen. Add a $5 price floor unless penny stocks are the point. Low-priced, high-percentage movers carry spread and manipulation risk that a screen does not show.
- Saving screens with vague names. Name them by their rules so you know what you are running.
- Running fundamental screens every hour. Those numbers change quarterly. Weekly is plenty.
Frequently asked questions
Is the Yahoo Finance stock screener free?
Yes. The presets and custom screens work on a free Yahoo account, and you need to sign in to save a screen. Premium screener filters such as analyst ratings and holders are listed under the Gold plan, at $39.95 a month billed yearly.
Is the Yahoo Finance screener real-time?
It depends on the exchange. Yahoo's delay table lists the Nasdaq Stock Exchange as real-time, while OTC Markets and the OPRA options feed are 15 minutes behind and several futures exchanges are 10 to 30 minutes. Check the table for the market you trade.
Does Yahoo Finance have a stock scanner for day trading?
Not in the strict sense. The screener filters a list when you load it and does not push alerts when a condition triggers. Day Gainers and Most Active work as after-the-fact lists. For live intraday triggers you need a streaming scanner.
What does the Undervalued Growth Stocks screener filter for?
Yahoo describes it as stocks with earnings growth above 25% and "relatively low PE and PEG ratios." The exact valuation cutoffs are not stated on the page, so add your own if you want a fixed definition.
How often is the Most Shorted Stocks list updated?
It is built from short interest reports released every two weeks. FINRA collects positions twice a month as of set settlement dates and publishes them several days after each one.
Can I screen by technical indicators on Yahoo Finance?
The free filter groups cover statistics, financials, valuation, price change, and volume. Yahoo sells technical indicators as part of its paid plans. For free indicator-based screens, TradingView and Finviz cover more ground.
Can I save screens on mobile?
Yes. In a mobile browser, sign in, tap the Menu icon, then Research, Screeners, and Create. Set filters, apply them, and tap Save.
Where Quant AI fits
The Yahoo Finance screener is good at turning thousands of tickers into a short list. It does not look at the charts on that list, and that is where the entry, the stop, and the reason for the trade come from. The price action guide is where to build that skill by hand.
Quant AI helps with that step. Screenshot a chart from your shortlist and it reads the trend, marks the support and resistance levels it finds, and flags the patterns on the chart. It does not tell you whether to take the trade, and it reads the chart you give it, so a chart drawn on delayed data gets read as drawn. It saves you the first pass on the dozen names your screen returned, so your time goes to the few that deserve a closer look.