The Best Free Stock Analysis Software in 2026: A Free Research Stack for Beginners
Finviz, TradingView, Stock Analysis, Koyfin and SEC EDGAR compared on what their free tiers really include, with a worked example of one stock researched for $0.
The best free stock analysis software is a stack of four tools, because no single free tier does the whole job. Use Finviz to screen, TradingView's free Basic plan to read the chart, Stock Analysis or Koyfin Free for the financial statements, and the SEC's EDGAR search for the filings themselves. All of that costs $0, and for a beginner or a swing trader it covers most of what a paid platform does. The gaps are real-time data, alerts, and long financial histories, and the sections below say exactly where each free tier stops.
The order matters as much as the tools. A screener hands you names, a chart tells you whether there is a trade, the financials tell you what the business is doing, and the filing tells you what management had to disclose under penalty of law. Skip a step and you end up buying a ticker you have only half looked at.
Quick comparison
| Tool | Job it does best | What the free tier includes | Where free stops | Cheapest upgrade |
|---|---|---|---|---|
| Finviz (free) | Screening US stocks | Screener, quotes delayed 1 minute, 3 years of financial statements | No intraday charts, no alerts, no export, 1 watchlist of 10 tickers | Elite, $39.50/mo or $299.50/yr |
| TradingView Basic | Charting and technical analysis | 2 indicators per chart, 1 chart per tab, 3 price alerts, 5K historical bars | 1 saved layout, extra real-time data is paid | Essential, billed annually |
| Stock Analysis (free) | Financial statements and ratios | Statements, statistics and charts for 150,000+ stocks and funds | Watchlists, alerts and the longest histories sit in Pro | Pro, $79/yr or $9.99/mo |
| Koyfin Free | Fundamentals with good charts | 2 watchlists, 2 screens, 2 years of financials, 1 year of estimates | History too short to see a full cycle | Plus, $39/mo |
| SEC EDGAR | The primary source | Every filing, full-text search back to 2001, live filing feed, CSV export | No analysis, you read the documents yourself | Free, always |
| Quant AI | Reading a chart you already have | Marks trend, levels and setup from a screenshot | No screener, no fundamentals, no filings | See the app |
Limits and prices are what each vendor's own page showed when we checked in November 2026. Free tiers change, sometimes quarterly, so check before you build a habit around one.
Stock analysis is four jobs, and free tools each do one
Most "best free stock analysis tools" lists rank products against each other as if they compete. They mostly do not. A screener narrows thousands of tickers to a short list by rules you set. A charting platform shows what price and volume have done and where the levels are. A fundamentals site turns financial statements into tables and ratios you can compare across years. A filing database holds the documents those numbers came from.
Each free product is strong at one of those jobs and thin at the rest. Finviz's free charts are daily only. TradingView has financials, but its free plan gives you one chart per tab and two indicators. Stock Analysis has years of statements and a simple price chart. EDGAR has everything and explains nothing. Once you see the jobs separately, the question "which one is best" turns into "which one do I use for this step," and the answer is clear for every step.
The practical upshot for a beginner: you do not need to choose one tool and live with its weaknesses. Open four browser tabs. Each free tier exists to sell you the paid version of the one you use most, so each is generous in its core job and stingy everywhere else.
Finviz, best free screener for US stocks
Finviz is still one of the fastest ways to go from "the whole US market" to twenty names. You pick filters from dropdowns (market cap, average volume, price relative to the 50-day moving average, earnings growth, sector) and the list updates.
Its free tier is narrower than people remember. Finviz's Elite page lists free quotes as delayed 1 minute for NASDAQ, NYSE and AMEX, futures delayed 20 minutes, three years of financial statements, one watchlist holding ten tickers and one portfolio. Intraday charts, alerts, CSV export and multi-chart layouts are Elite only. Elite costs $39.50 a month or $299.50 a year according to the same page's FAQ, which also shows an annual rate worked out to $24.96 a month.
For a swing trader the one-minute delay rarely matters. You screen in the evening and act the next day. For a day trader it is disqualifying, and so is the lack of intraday charts. If that is you, our comparison of real-time stock scanners for day trading covers the paid tools built for that job.
Where Finviz is weak: three years of statements is too short to judge a cyclical business, and you cannot save more than one small watchlist. Use it to find names, then leave. We cover its screener against TradingView's and your broker's in more depth in the best free stock screener apps.
TradingView Basic, best free charts
If you read charts, TradingView's free plan is where you will spend most of your time. It draws clean candlestick charts on every timeframe, has the full drawing toolkit for trendlines and zones, and covers stocks, ETFs, crypto and forex in one place.
The limits are specific. TradingView's pricing page lists the Basic plan at 2 indicators per chart, 1 chart per tab, 1 saved chart layout, 3 active price alerts and 5K historical bars. Extra real-time data requires a paid plan, and "no ads" is listed only from Essential up. The cheapest paid plan, Essential, showed €12.95 a month billed annually when we checked from Europe; the price you see depends on your region.
Two indicators sounds tight, and it is a useful constraint. Most beginners pile on six indicators that all measure momentum and then cannot tell which one to believe. Two slots force a choice: a moving average for trend and one oscillator, or a moving average and volume-weighted price. Our walkthrough of how to do technical analysis on a stock uses a two-indicator setup for exactly that reason.
The real cost of Basic is the single layout and the alerts. With one saved layout you redraw your levels when you switch between a daily and an hourly setup, and three alerts cover three stocks, not a watchlist. That is fine while you are learning and gets annoying once you trade a dozen names.
Stock Analysis, best free financial statements
Stock Analysis (stockanalysis.com) does one job very well: it turns income statements, balance sheets and cash-flow statements into clean, comparable tables. Its homepage says it covers 150,000+ global stocks and funds, with statistics, charts and financial data per ticker. For "is revenue growing, are margins holding, is the share count rising," it is the quickest free answer we know.
The free tier has limits the homepage does not spell out. Its Pro page lists Pro at $79 a year ($6.58 a month billed annually) or $9.99 monthly, and describes Pro's financial history as "10-40 years and growing," along with saved screeners and data tables of up to 1,000 rows. Free accounts see a shorter history. We could not find the exact free limit on a first-party page, so check how many years a ticker shows before you rely on it for a long-term view.
Stock Analysis is not a charting tool. Its price chart is fine for a glance and useless for finding levels. Pair it with TradingView.
Koyfin Free, best fundamentals with real charts
Koyfin sits between a charting platform and a fundamentals site, and its charts are good. Koyfin's pricing page lists the Free plan at 2 watchlists and 2 screens, 2 years of financials and 1 year of estimates, with "advanced charting" included. The cheapest paid plan, Plus, is $39 a month.
Two years of financials is the catch. It shows you the last two annual reports, which is not enough to see whether this year's margin is normal or a peak. Koyfin Free is best for comparing a handful of companies side by side on valuation and estimates, on a chart you can actually read. For long histories, use Stock Analysis; for the raw documents, use EDGAR.
SEC EDGAR, the free source the others are built on
Every number on every site above came from a filing. US public companies file their annual report (10-K), quarterly reports (10-Q), material-event reports (8-K) and insider trades (Form 4) with the SEC, and all of it is free on EDGAR.
The search tools are better than most people expect. The SEC's filing search page lists Full Text Search ("find keywords and phrases in more than 20 years of EDGAR filings"), Company Search by name or ticker, and a Latest Filings feed that shows "real-time filings as they are submitted into the EDGAR system." The full-text search tool covers filings since 2001, filters by form type, date range and company location, and exports results to CSV.
Full-text search is the feature that pays off. Search a company's filings for "going concern," "material weakness," "customer concentration" or the name of its largest customer, and you find in thirty seconds what a summary site never shows you. The Latest Filings feed is how you see an 8-K the moment it lands, before the headline is written.
EDGAR does no analysis. It has no screener, no charts and no ratios. That is why it sits at the end of the stack: you arrive with one ticker and specific questions.
Your broker, the underrated free option
If you already have a funded brokerage account, check its research and charting tools before you sign up for anything. Many brokers include real-time quotes, full charting and third-party research reports for account holders at no extra cost. What you get varies a lot by broker and sometimes by account size, so we will not list specifics here. Our guide to free live stock charts explains how to tell whether a broker chart is truly real-time, and the best app for beginner stock trading compares what the main brokers include.
A worked example: one stock, researched for $0
Here is the full stack on one hypothetical stock. The ticker and numbers below are illustrative, chosen to show the process; they are not a real company or a recommendation.
Step 1, screen (Finviz, 5 minutes). The screen: US stocks, market cap above $2 billion, average volume above 1 million shares, price above the 50-day and 200-day simple moving averages, EPS growth this year positive. Say that returns 40 names. Sort by performance over the past quarter and look at the top 10. One of them, call it XYZ, has pulled back to its 50-day average after a run.
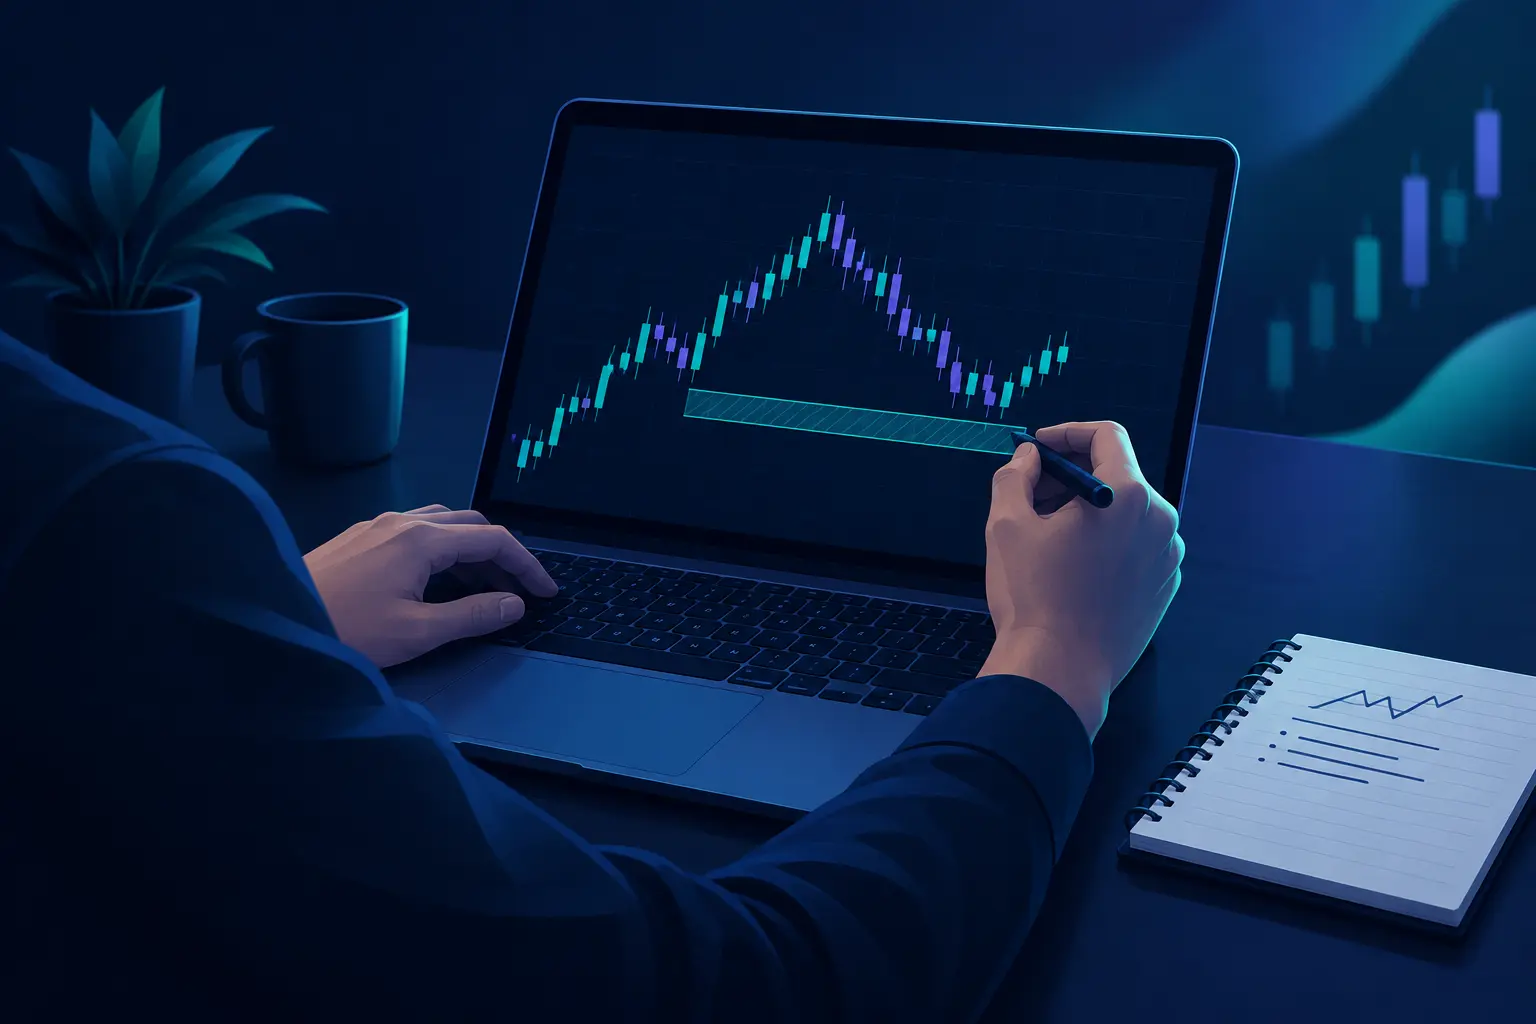
Step 2, chart (TradingView Basic, 10 minutes). Open XYZ on the daily chart. Spend your two indicator slots on the 50-day moving average and RSI. Price ran from $62 to $81 over two months, and has pulled back to $74, where it stalled twice in the last month, which is now a support zone of roughly $73 to $75. RSI has cooled from above 70 to around 50. Draw the zone. Set one of your three free alerts at $73, just under the zone.
Step 3, fundamentals (Stock Analysis, 5 minutes). Revenue grew in each of the last three years, operating margin is stable, and the share count is flat, so the earnings growth is not coming from buybacks alone. Nothing here argues against the chart.
Step 4, filings (EDGAR, 10 minutes). Full-text search XYZ's filings for "material weakness" and "going concern": nothing. Then read the most recent 8-K. Suppose it is an earnings release dated two weeks ago. Note the next earnings date, because holding a swing trade through earnings is a separate decision with a separate risk.
Step 5, size the trade (a calculator). Say you have a $5,000 account and risk 1% per trade, so $50. Entry near $74.50, stop at $72.50 under the zone, so $2 of risk per share. $50 divided by $2 is 25 shares, a position of about $1,860. If the stop is hit you lose roughly $50 plus any slippage, and a gap through the stop on bad news can cost more. Our guide to risk management in trading covers why the per-trade risk number comes first and the share count second.
That is 30 minutes and $0. The free stack did not tell you whether to take the trade, and nothing can. It gave you a level, a stop, a size and a clean filing record, which is what a paid platform would have given you too.
Where the free tiers actually run out
Free stock analysis software hits four walls, and which one bites depends on how you trade.
Real-time data. Finviz free is delayed one minute; extra real-time data on TradingView is paid. For swing and position traders this barely matters. For anyone trading the open it matters a lot, because a minute is long enough for a small cap to move several percent.
Alerts. Finviz free has none. TradingView Basic has three price alerts. If your method depends on being told when a stock reaches a level, three alerts limit you to three stocks at a time. Alerts are the single most common reason people upgrade.
History. This one is easy to miss. The chart below shows how many years of financial statements each tier shows, from the vendors' own pages.
Bar chart of years of financial statements by tier: Koyfin Free 2 years, Finviz free 3 years, Finviz Elite 8 years, Stock Analysis Pro at least 10 years (its page says 10 to 40).
Two or three years of statements cannot show you a full business cycle. A retailer, a chipmaker or a bank can look excellent for three years and then give it all back. If you hold for months, long history matters, and Stock Analysis Pro at $79 a year is the cheapest fix. Or go to EDGAR, where every 10-K back to 2001 is free, and read the older ones yourself.
Layouts and watchlists. One TradingView layout and one ten-ticker Finviz watchlist are enough to learn on. They stop being enough when you follow more than ten names.
If you do upgrade, upgrade the one tool you use most. Here is what each cheapest upgrade costs over a year, from the same pages.
Bar chart of the yearly cost of each cheapest upgrade: Stock Analysis Pro $79 per year, Finviz Elite $299.50 per year, Koyfin Plus $468 per year at $39 a month.
A $5,000 account that pays $468 a year for data needs more than a 9% return just to cover the subscription. That arithmetic is why the free stack is the right starting point for most beginners: pay only once a specific limit is costing you trades.
Traps in free stock data
Free data is accurate enough for most retail decisions. It still has habits that can mislead you.
Filing dates and period dates are different. A quarter that ends on March 31 might not be reported until early May. A site that lines up the numbers by period end makes it look like the market knew in March. When you test whether "good earnings" moved the stock, use the filing date from EDGAR.
Screeners only show survivors. A screen of today's listed stocks leaves out every company that went bankrupt or was acquired. If you look back and ask "how did stocks that pulled back to the 50-day do," you only see the ones still alive, which flatters any buy-the-dip idea. Our guide on how to backtest a trading strategy covers this bias in more detail.
Free sites disagree with each other. Finviz, Stock Analysis and Koyfin calculate some ratios differently (trailing versus forward, GAAP versus adjusted). If two sites show different P/E ratios for the same stock, check which earnings figure each uses before you decide one is wrong.
Delayed quotes look live. A one-minute delay is invisible on a quiet afternoon. At the open, the price on a delayed screen can be well away from the price you will get filled at. Check the timestamp before you size an order off a free quote.
Where Quant AI fits
Quant AI is not a screener and does not read financial statements or filings. It does one step of the stack: you send it a screenshot of a chart, from TradingView, Finviz, your broker or anywhere else, and it marks the trend, the support and resistance levels it finds and the setup it reads, in a few seconds. There is no account to connect and no layout to build, which matters on a free TradingView plan where you get one layout and two indicators.
It fits at Step 2 of the worked example: a second read on the chart before you commit to a level, or a quick read on a chart you found somewhere else. It does not know the company's earnings, its filings or its next earnings date, so the other three steps stay yours. And like any chart read, its levels are a starting point for your plan, not a forecast. Our roundup of apps that read stock charts for beginners compares it with the alternatives.
How to choose
- You are new and want one place to start: TradingView Basic. Charts are where most beginners spend their time, and its screener and financials are good enough to begin with.
- You swing trade US stocks: Finviz free to screen, TradingView Basic to chart, EDGAR for the filings. Add Stock Analysis when you start holding for months.
- You invest for the long term: Stock Analysis for statements, EDGAR for the 10-Ks, and pay for Stock Analysis Pro first if you want long histories.
- You compare companies within a sector: Koyfin Free, for side-by-side valuation and estimates on decent charts.
- You day trade: free tools will not cover you. Start with your broker's real-time platform, and see our scanner comparison for the paid options.
Common mistakes
- Treating a screener hit as a buy list. A screen returns stocks that passed your filters. Every one still needs a chart, a stop and a size.
- Filling TradingView's two slots with two momentum indicators. RSI and stochastics measure close to the same thing. Use one slot for trend and one for momentum or volume.
- Judging a business on two or three years of numbers. Short free histories hide cycles. Read an older 10-K on EDGAR before holding through a downturn.
- Paying for everything at once. Three subscriptions can easily cost more per year than a small account makes. Upgrade the one tool whose limit you hit every week.
- Skipping the filing. Summary sites leave out risk factors, footnotes and customer concentration. A five-minute EDGAR full-text search is the cheapest risk check there is.
Frequently asked questions
What are the best stock analysis tools?
For free tools, Finviz for screening, TradingView for charts, Stock Analysis or Koyfin for financial statements, and SEC EDGAR for filings. Each is strongest at one job, so most people use two to four of them together.
What are the best stock tools for beginners?
TradingView's free Basic plan is the easiest single starting point because it combines charts, a screener and basic financials. Add Finviz once you want faster screening and EDGAR once you start reading filings. Practice on a simulator before risking money; our stock trading simulator comparison covers the free options.
What are the best free tools to analyze stocks and monitor market trends?
To analyze individual stocks, use the four-tool stack above. To watch broad trends, TradingView's free charts of the major index ETFs and their sector ETFs cover most of what you need. Neither tells you where the market goes next.
Is free stock analysis software good enough?
For swing trading and long-term investing, usually yes. Between them, the free tiers cover screening, daily charts, recent financials and every filing. They fall short on real-time data, alerts and long financial histories, which matter most to day traders and to investors judging cyclical businesses.
Is Finviz free real-time?
No. Finviz's own Elite page lists free quotes as delayed 1 minute for NASDAQ, NYSE and AMEX, and futures delayed 20 minutes. Real-time quotes, including premarket and after-hours, are part of Elite.
How many indicators can I use on TradingView for free?
Two per chart on the Basic plan, per TradingView's pricing page, along with one chart per tab, one saved layout and three active price alerts.
Where can I read a company's 10-K for free?
On SEC EDGAR. Search by company name or ticker, or use full-text search to find specific words across filings since 2001.
Can free tools tell me which stock to buy?
No tool can. Free software organizes information so you can make your own decision faster. Every trade still carries the risk of loss, including losses larger than your stop if a stock gaps.
The bottom line
The best free stock analysis software is four tools working together: Finviz to screen, TradingView Basic to chart, Stock Analysis or Koyfin for the numbers, and EDGAR for the filings. Together they cover most of what a beginner or a swing trader needs for $0. Pay only when one specific limit, usually real-time data, alerts or financial history, starts costing you trades, and pay for that one tool first.